前言
之前我们的所有的场景,都是通过 prometheus server 定期去实例(instance)拉取(pull)数据, 但是有以下两种情况会有问题:
- 由于子网络或者防火墙的关系, prometheus server 不能直接拉取各个 instance 的指标数据
- 监控程序不是在线服务系统,而是批处理作业,批处理作业的特点是它们不会连续运行,这使得抓取它们变得困难。所以 prometheus 如果是定期拉取的话,就会出现 instance 没有运行的情况
基于以上的情况,所以 prometheus server 提供了另一种让实例(instance) 主动 push 指标数据的能力, 那就是借助另一个程序: Pushgateway 来进行代理, 让其他的程序先把数据抛送到 Pushgateway, 然后再让 prometheus server 定期去 Pushgateway 拉取数据
Pushgateway 使用场景
使用 Pushgateway 会有几个问题:
- 当通过单个 Pushgateway 监控多个实例时,Pushgateway 会有单点故障的潜在问题
- 没有实例的自动健康监控指标
up - 只要是通过 Pushgateway 代理推送给 prometheus server 的实例的指标,会一直存在,哪怕这个实例后面不再抛送指标给 Pushgateway,但是 prometheus 依然会保留这个实例的指标
正常情况下,如果是通过 prometheus 直接拉取的实例对象,一旦实例不再监听,后面这个实例的指标将会随着生命周期的过期从而从 prometheus 的时序数据库中删除, 但是通过 Pushgateway 代理推送的实例不行,只要有抛送过,就会一直存在,不管该实例后续是删除,还是重命名都没用。
这个是因为作为指标缓存的 Pushgateway 的生命周期从根本上独立于将指标推送给它的实例的生命周期。所以如果要清除这些实例的旧的指标,那么就要手动调用 Pushgateway 的 API 来删除
而且官方认为使用 Pushgateway 的唯一的有效用例就是捕获服务级批处理作业 的结果,服务级批处理作业是在语义上与特定机器或作业实例不相关的作业(例如,为整个服务删除多个用户的批处理作业)。此类作业的指标不应包含机器或实例标签,以将特定机器或实例的生命周期与推送的指标分离。
其他的场景都应该使用 prometheus server 的 pull 模式来获取数据,如果是防火墙或者 NAT 阻止数据的采集,那么就要应该将 prometheus server 也移到网络屏障后面。
安装
接下来我们安装一下,也是采用二进制包的安装方式,下载地址1
2
3
4
5
6
7
8
9
10
11
12
13
14
15
16
17
18
19
20
21
22
23
24
25
26
27
28
29
30
31
32
33
34
35
36
37
38
39
40# 下载安装,解压
[root@VM-64-9-centos ~]# cd /usr/local/
[root@VM-64-9-centos local]# wget https://github.com/prometheus/pushgateway/releases/download/v1.5.1/pushgateway-1.5.1.linux-amd64.tar.gz
[root@VM-64-9-centos local]# tar zxf pushgateway-1.5.1.linux-amd64.tar.gz
[root@VM-64-9-centos local]# mv pushgateway-1.5.1.linux-amd64 pushgateway
# 添加到 service,并且设置为开机自启动
[root@VM-64-9-centos local]# cat /usr/lib/systemd/system/pushgateway.service
[Unit]
Description=Pushgateway
Documentation=https://prometheus.io/
After=network.target
[Service]
Type=simple
ExecStart=/usr/local/pushgateway/pushgateway
ExecStop=/bin/kill -s QUIT $MAINPID
Restart=on-failure
[Install]
WantedBy=multi-user.target
[root@VM-64-9-centos local]# systemctl daemon-reload
[root@VM-64-9-centos local]# systemctl enable pushgateway
# 启用服务
[root@VM-64-9-centos local]# systemctl start pushgateway
[root@VM-64-9-centos local]# systemctl status pushgateway
● pushgateway.service - Pushgateway
Loaded: loaded (/usr/lib/systemd/system/pushgateway.service; enabled; vendor preset: disabled)
Active: active (running) since Wed 2022-12-14 14:09:30 CST; 9s ago
Docs: https://prometheus.io/
Main PID: 30658 (pushgateway)
CGroup: /system.slice/pushgateway.service
└─30658 /usr/local/pushgateway/pushgateway
Dec 14 14:09:30 VM-64-9-centos systemd[1]: Started Pushgateway.
Dec 14 14:09:30 VM-64-9-centos pushgateway[30658]: ts=2022-12-14T06:09:30.617Z caller=main.go:100 level=info msg="starting pushgateway" version="(version=1.5.1, branch=HEAD, revision=7afc96cfc5...30eea22b70e)"
Dec 14 14:09:30 VM-64-9-centos pushgateway[30658]: ts=2022-12-14T06:09:30.617Z caller=main.go:101 level=info build_context="(go=go1.19.3, user=root@fc81889ee1a6, date=20221129-16:30:38)"
Dec 14 14:09:30 VM-64-9-centos pushgateway[30658]: ts=2022-12-14T06:09:30.618Z caller=tls_config.go:232 level=info msg="Listening on" address=[::]:9091
Dec 14 14:09:30 VM-64-9-centos pushgateway[30658]: ts=2022-12-14T06:09:30.618Z caller=tls_config.go:235 level=info msg="TLS is disabled." http2=false address=[::]:9091
他有一个后台,端口是 9091
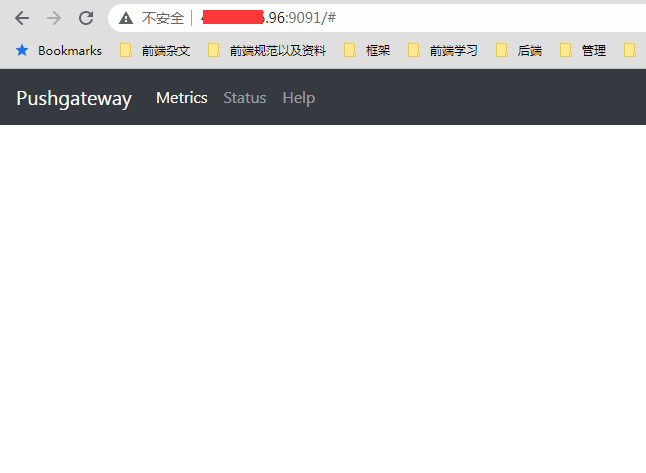
可以看到 metrics 这边都是空的,没有数据,那是因为我们还没有往 Pushgateway 上推送任何数据
配置到 prometheus
接下来将 Pushgateway 配置到 prometheus server 上,让它可以被抓取, prometheus.yml 的 scrape_configs 加这个小节1
2
3
4
5- job_name: "pushgateway"
honor_labels: true
static_configs:
- targets:
- localhost:9091
然后热更新一下 prometheus 的配置文件,就可以看到 Pushgateway 这个实例有监控了
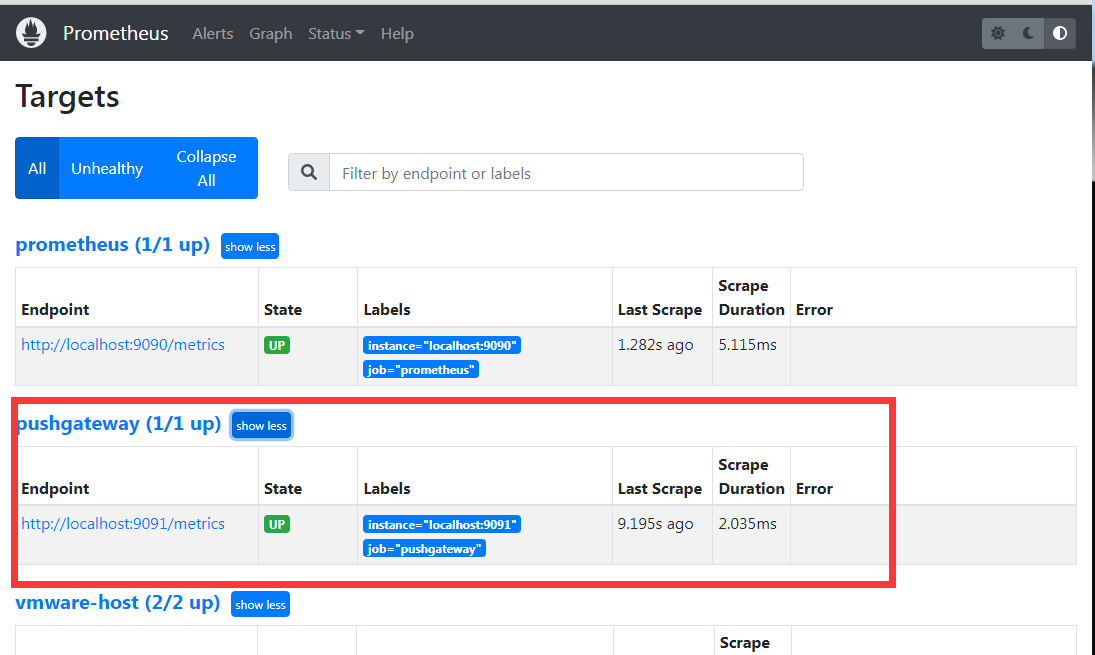
这边要注意 honor_labels 这个配置,这个配置要为 true (不设置的话,默认为 false), 这个是因为 prometheus 配置 Pushgateway 的时候,也会指定 job 和 instance,但是它只表示 Pushgateway 实例本身,不能真正表达收集数据的含义。
所以配置 Pushgateway 需要添加 honor_labels:true 参数,避免收集数据本身的 job 和 instance 被覆盖。详细可参考这里官网文档对该参数的说明。
使用 API 抛送数据到 Pushgateway
关于 Pushgateway 的 API 的方式方式,可以查看官方 github 文档
基本上抛送数据的格式如下:1
http://<ip>:9091/metrics/job/<JOBNAME>{/<LABEL_NAME>/<LABEL_VALUE>}
<JOB_NAME>用作job标签的值,后跟任意数量的其他标签对(可能包含也可能不包含 instance 标签)
如果正文有设置标签了,会覆盖 url 路径所设置的同名标签的值
单行抛送
接下来我们简单推送一下单行的1
[root@VM-64-9-centos prometheus]# echo 'my_test_name 1' | curl --data-binary @- http://localhost:9091/metrics/job/my_test/
抛送了以下数据:
- 指标名称是
my_test_name, value 是 1 - 该指标的标签组是
job=my_test
这时候就可以从后台看到这一个指标了
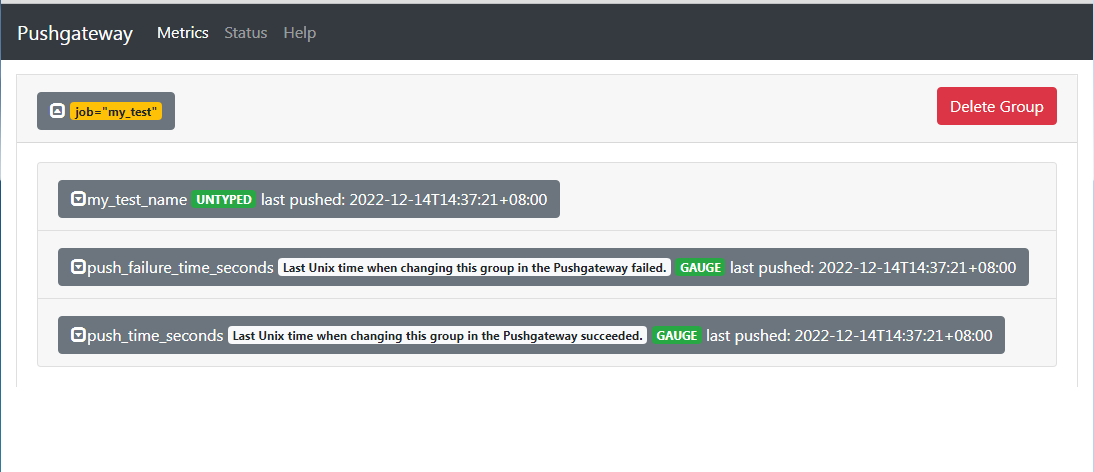
可以看到,除了我们上传的指标,还多了两个指标 push_time_seconds 和 push_failure_time_seconds, 他们的作用就是用来表示上一次抓取成功/失败的时间。也会随之被 promethues 拉取到
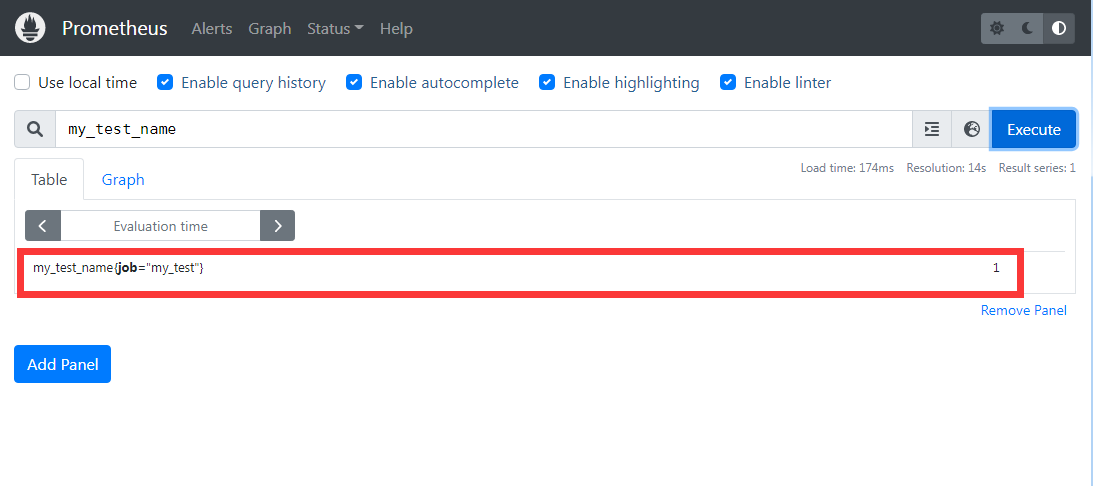
同时也可以在 prometheus 后台查到这个指标
多行抛送
接下来我们尝试多行多标签的方式来抛送指标1
2
3
4
5
6
7
8
9
10cat <<EOF | curl --data-binary @- http://localhost:9091/metrics/job/my_test2/instance/my_test_instance
## HELP my_test2_http_requests_total Counter of HTTP requests.
# TYPE my_test2_http_requests_total counter
my_test2_http_requests_total{code="200",handler="/ready"} 74
my_test2_http_requests_total{code="200",handler="/reload"} 21
my_test2_http_requests_total{code="200",handler="/alerts"} 58
# HELP my_test2_go_goroutines Number of goroutines that currently exist.
# TYPE my_test2_go_goroutines gauge
my_test2_go_goroutines 43
EOF
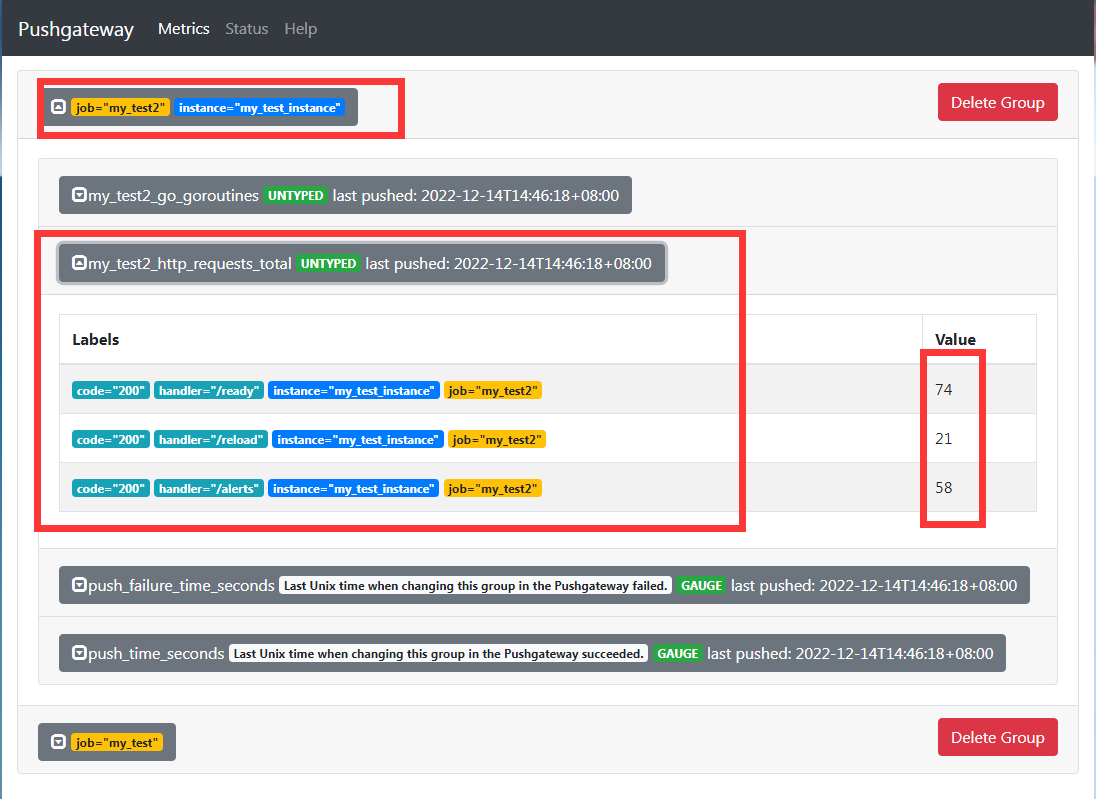
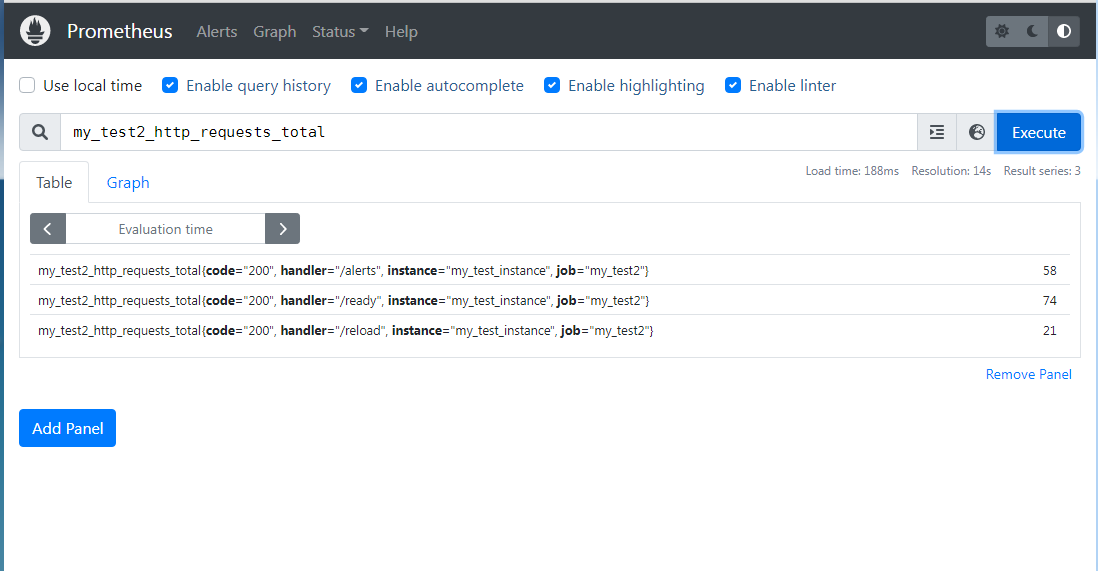
后台可以查
文件抛送
我们可以基于文件来抛送1
2
3
4
5
6
7
8
9
10
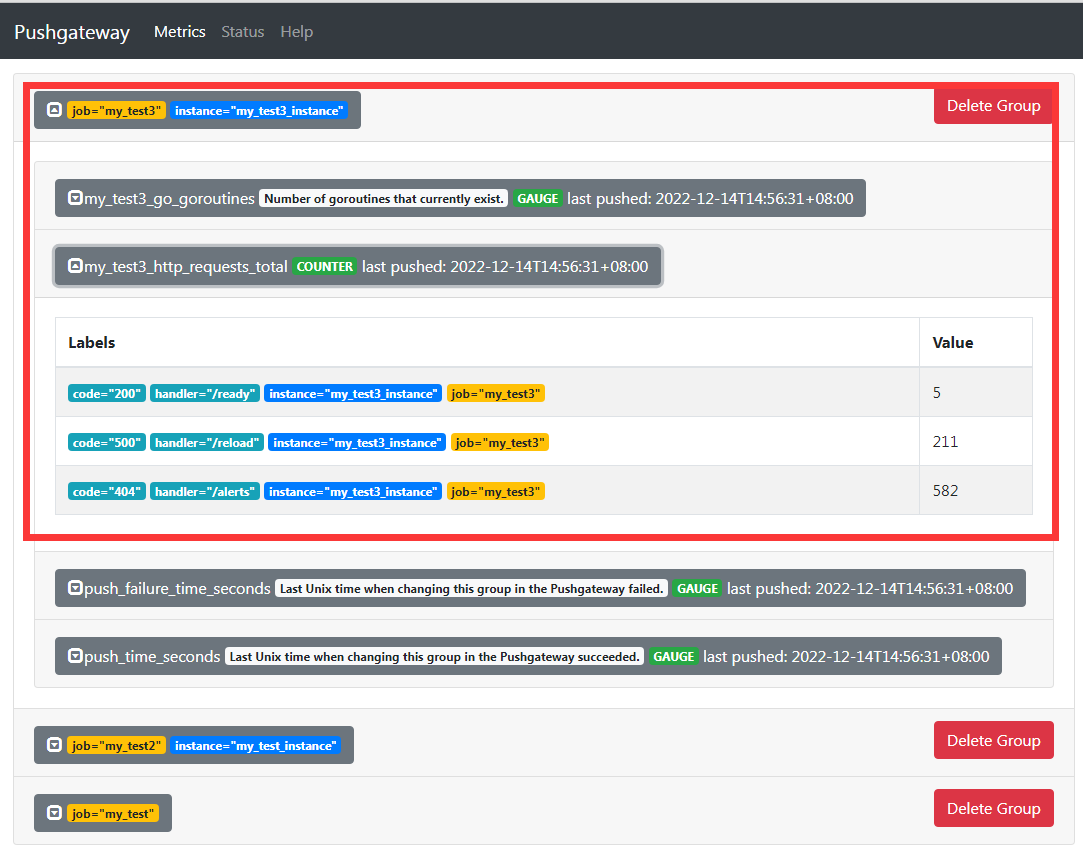
11[root@VM-64-9-centos prometheus]# cat push-test.txt
## HELP my_test3_http_requests_total Counter of HTTP requests.
# TYPE my_test3_http_requests_total counter
my_test3_http_requests_total{code="200",handler="/ready"} 5
my_test3_http_requests_total{code="500",handler="/reload"} 211
my_test3_http_requests_total{code="404",handler="/alerts"} 582
# HELP my_test3_go_goroutines Number of goroutines that currently exist.
# TYPE my_test3_go_goroutines gauge
my_test3_go_goroutines 99
[root@VM-64-9-centos prometheus]# curl -X POST --data-binary @push-test.txt http://localhost:9091/metrics/job/my_test3/instance/my_test3_instance
删除指标
我们可以通过删除标签,来移除该标签下的所有指标,比如我想将第二次抛送的 job=my_test2 和 instance=my_test_instance 下面的指标全部清掉,那么就是1
curl -X DELETE http://localhost:9091/metrics/job/my_test2/instance/my_test_instance
这时候在后台就看不到这两个指标了
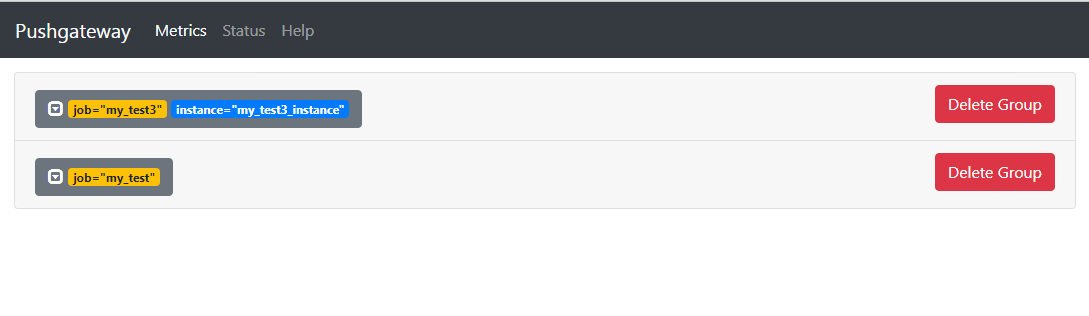
同时这时候在 prometheus 的后台也查不到这两个标签所对应的指标了。
通过这种方式才能彻底删除 Pushgateway 所代理的实例相关标签
接口 API
Pushgateway 提供了一些接口 API 和 管理 API,用于更好的管理,比如查询当前的指标:1
2
3
4
5
6
7
8
9
10
11
12
13
14
15
16
17
18
19
20
21
22
23
24
25
26
27
28
29
30
31
32
33
34
35
36
37
38
39
40
41
42
43
44
45
46
47
48
49
50
51
52
53
54
55
56
57
58
59
60
61
62
63
64
65
66
67
68
69
70
71
72
73
74
75
76
77
78
79
80
81
82
83
84
85
86
87
88
89
90
91
92
93
94
95
96
97
98
99
100
101
102
103
104
105
106
107
108
109
110
111
112
113
114
115
116[root@VM-64-9-centos prometheus]# curl -X GET http://localhost:9091/api/v1/metrics
{
"status": "success",
"data": [{
"labels": {
"job": "my_test"
},
"last_push_successful": true,
"my_test_name": {
"time_stamp": "2022-12-14T14:37:21.928608787+08:00",
"type": "UNTYPED",
"metrics": [{
"labels": {
"instance": "",
"job": "my_test"
},
"value": "1"
}]
},
"push_failure_time_seconds": {
"time_stamp": "2022-12-14T14:37:21.928608787+08:00",
"type": "GAUGE",
"help": "Last Unix time when changing this group in the Pushgateway failed.",
"metrics": [{
"labels": {
"instance": "",
"job": "my_test"
},
"value": "0"
}]
},
"push_time_seconds": {
"time_stamp": "2022-12-14T14:37:21.928608787+08:00",
"type": "GAUGE",
"help": "Last Unix time when changing this group in the Pushgateway succeeded.",
"metrics": [{
"labels": {
"instance": "",
"job": "my_test"
},
"value": "1.6709998419286087e+09"
}]
}
}, {
"labels": {
"instance": "my_test3_instance",
"job": "my_test3"
},
"last_push_successful": true,
"my_test3_go_goroutines": {
"time_stamp": "2022-12-14T14:56:31.653276763+08:00",
"type": "GAUGE",
"help": "Number of goroutines that currently exist.",
"metrics": [{
"labels": {
"instance": "my_test3_instance",
"job": "my_test3"
},
"value": "99"
}]
},
"my_test3_http_requests_total": {
"time_stamp": "2022-12-14T14:56:31.653276763+08:00",
"type": "COUNTER",
"metrics": [{
"labels": {
"code": "200",
"handler": "/ready",
"instance": "my_test3_instance",
"job": "my_test3"
},
"value": "5"
}, {
"labels": {
"code": "500",
"handler": "/reload",
"instance": "my_test3_instance",
"job": "my_test3"
},
"value": "211"
}, {
"labels": {
"code": "404",
"handler": "/alerts",
"instance": "my_test3_instance",
"job": "my_test3"
},
"value": "582"
}]
},
"push_failure_time_seconds": {
"time_stamp": "2022-12-14T14:56:31.653276763+08:00",
"type": "GAUGE",
"help": "Last Unix time when changing this group in the Pushgateway failed.",
"metrics": [{
"labels": {
"instance": "my_test3_instance",
"job": "my_test3"
},
"value": "0"
}]
},
"push_time_seconds": {
"time_stamp": "2022-12-14T14:56:31.653276763+08:00",
"type": "GAUGE",
"help": "Last Unix time when changing this group in the Pushgateway succeeded.",
"metrics": [{
"labels": {
"instance": "my_test3_instance",
"job": "my_test3"
},
"value": "1.6710009916532767e+09"
}]
}
}]
}
具体可以看: github pushgateway
使用客户端 sdk 实现 push
接下来用 golang 的 sdk 实现一下 push 到 pushgateway 的示例,代码如下:1
2
3
4
5
6
7
8
9
10
11
12
13
14
15
16
17
18
19
20
21
22
23package main
import (
"fmt"
"github.com/prometheus/client_golang/prometheus"
"github.com/prometheus/client_golang/prometheus/push"
)
func ExamplePusher_Push() {
completionTime := prometheus.NewGauge(prometheus.GaugeOpts{
Name: "db_backup_last_completion_timestamp_seconds",
Help: "The timestamp of the last successful completion of a DB backup.",
})
completionTime.SetToCurrentTime()
// 设置标签 job="db_backup", db="customers"
if err := push.New("http://43.xx.xx.96:9091/", "db_backup").Collector(completionTime).Grouping("db", "customers").Push(); err != nil {
fmt.Println("Could not push completion time to Pushgateway:", err)
}
}
func main() {
ExamplePusher_Push()
}
接下来执行一下这个文件 go run main.go,就可以抛送了, 就可以在 Pushgateway 后台看到

注意事项
使用 Pushgateway 有几个注意事项:
1. 指标值只能是数字类型,非数字类型报错。
1 | [root@VM-64-9-centos prometheus]# echo 'my_test_name hello' | curl --data-binary @- http://localhost:9091/metrics/job/my_test/ |
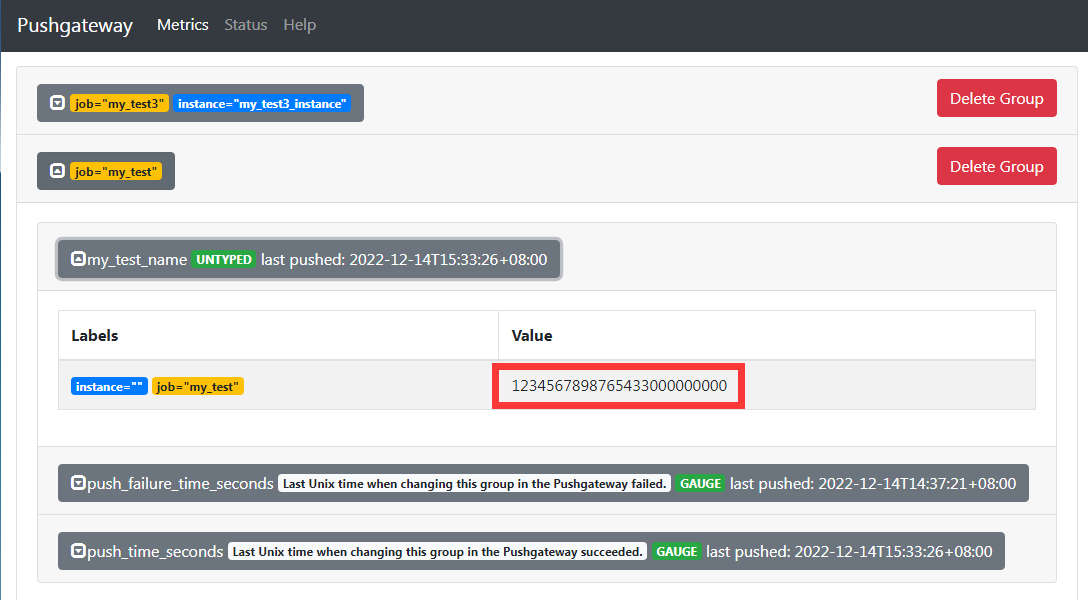
2. 指标值支持最大长度为 16 位,超过16 位后默认置为 0
1 | echo 'my_test_name 1234567898765432999999999' | curl --data-binary @- http://localhost:9091/metrics/job/my_test/ |
实际是
3. Pushgateway 数据持久化操作
默认 Pushgateway 不做数据持久化操作,当 Pushgateway 重启或者异常挂掉,会导致数据的丢失。
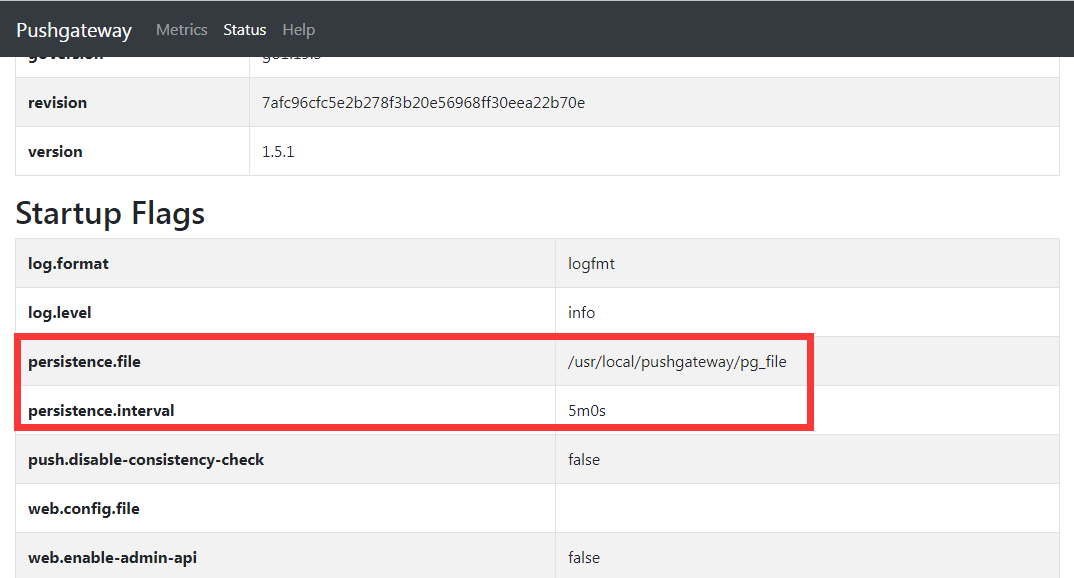
我们可以通过启动时添加 --persistence.file 和 --persistence.interval 参数来持久化数据。
--persistence.file表示本地持久化的文件,将 Push 的指标数据持久化保存到指定文件,--persistence.interval表示本地持久化的指标数据保留时间,若设置为 5m,则表示 5 分钟后将删除存储的指标数据。
这时候就可以将 system 的启动命令改成1
ExecStart=/usr/local/pushgateway/pushgateway --persistence.file=/usr/local/pushgateway/pg_file --persistence.interval=5m
这时候启动的时候,就可以发现有这个文件了 /usr/local/pushgateway/pg_file, 同时配置上也可以看到
4. Pushgateway 推送及 Prometheus 拉取时间设置
Prometheus 每次从 Pushgateway 拉取的数据,并不是拉取周期内用户推送上来的所有数据,而是最后一次 Push 到 Pushgateway 上的数据,所以推荐设置推送时间小于或等于 Prometheus 拉取的时间,这样保证每次拉取的数据是最新 Push 上来的。
参考资料: