前言
经过前面的 prometheus 系列的学习,我们知道 prometheus 要监控和抓取的端点都要写在 prometheus.yml 这个配置文件,这种方式对于要监控实例较少的情况还行,但是不适合大规模的的集群。
尤其不适合用于使用容器和基于云的实例的动态集群,这些实例经常会出现变化,有可能新创建,有可能是下架。
而 prometheus 通过使用 服务发现 来通过自动化的机制来检测,分类新的变更实例情况。
服务发现的几种类别
prometheus 提供的服务发现其实种类很多,有很多是跟第三方集成,从配置文件所支持的 参数 来看,分别有:
具体集成的服务列表,官方文档也有: Service Discovery
| 类别 | 配置参数 |
|---|---|
| Azure 服务发现配置列表 | azure_sd_configs |
| Consul 服务发现配置列表 | consul_sd_configs |
| DigitalOcean 服务发现配置列表 | digitalocean_sd_configs |
| Docker 服务发现配置列表 | docker_sd_configs |
| DNS 服务发现配置列表 | dns_sd_configs |
| EC2 服务发现配置列表 | ec2_sd_configs |
| Eureka 服务发现配置列表 | eureka_sd_configs |
| 文件服务发现配置列表 | file_sd_configs |
| GCE 服务发现配置列表 | gce_sd_configs |
| Hetzner 服务发现配置列表 | hetzner_sd_configs |
| HTTP 服务发现配置列表 | http_sd_configs |
| IONOS 服务发现配置列表 | ionos_sd_configs |
| Kubernetes 服务发现配置列表 | kubernetes_sd_configs |
| Kuma 服务发现配置列表 | kuma_sd_configs |
| Lightsail 服务发现配置列表 | lightsail_sd_configs |
| Linode 服务发现配置列表 | linode_sd_configs |
| Marathon 服务发现配置列表 | marathon_sd_configs |
| AirBnB 的 Nerve 服务发现配置列表 | nerve_sd_configs |
| Nomad 服务发现配置列表 | nomad_sd_configs |
| OpenStack 服务发现配置列表 | openstack_sd_configs |
| OVHcloud 服务发现配置列表 | ovhcloud_sd_configs |
| PuppetDB 服务发现配置列表 | puppetdb_sd_configs |
| Scaleway 服务发现配置列表 | scaleway_sd_configs |
| Zookeeper Serverset 服务发现配置列表 | serverset_sd_configs |
| Triton 服务发现配置列表 | triton_sd_configs |
| Uyuni 服务发现配置列表 | uyuni_sd_configs |
本节主要讲 文件服务发现 和 HTTP 服务发现 这两种,其他第三方如果后续生产环境中,有用到的话,再补。
文件服务发现
文件服务发现,通过配置 file_sd_config
基于文件的服务发现提供了一种更通用的方式来配置静态目标,并用作插入自定义服务发现机制的接口。
它读取一组包含零个或多个列表 <static_config> 的文件。通过磁盘监视检测所有定义文件的更改并立即应用。文件可以 YAML 或 JSON 格式提供。
如果是 json 格式,那么就是:1
2
3
4
5
6
7
8
9[
{
"targets": [ "<host>", ... ],
"labels": {
"<labelname>": "<labelvalue>", ...
}
},
...
]
如果是 yml 格式,那么就是:1
2
3
4- targets:
[ - '<host>' ]
labels:
[ <labelname>: <labelvalue> ... ]
接下来我们实践一下,将之前抓取的这两台 node_exporter 换成用文件服务发现的方式来载入:1
2
3
4
5- job_name: "vmware-host"
static_configs:
- targets:
- 43.153.11.234:9100
- localhost:9100
改成:1
2
3
4- job_name: "vmware-host"
file_sd_configs:
- files:
- file_sd/vmware-host.yml
对于文件发现服务,没有必要设置 refresh_interval 这个参数,因为一旦文件出现变更, prometheus 会马上知道并应用新的内容
整个过程如下:1
2
3
4
5
6
7
8
9
10
11
12
13
14
15
16
17
18
19
20
21
22
23
24
25
26
27
28
29
30
31
32
33
34
35
36
37
38
39
40
41
42
43
44
45
46
47
48# 在 prometheus 目录下创建 文件发现的 yml 文件
[root@VM-64-9-centos prometheus]# cat file_sd/vmware-host.yml
# node 节点监控服务发现配置
- targets:
- 43.153.11.234:9100
- localhost:9100
# 修改 prometheus.yml 文件
[root@VM-64-9-centos prometheus]# cat prometheus.yml
# my global config
global:
scrape_interval: 15s
evaluation_interval: 15s
alerting:
alertmanagers:
- static_configs:
- targets:
- "localhost:9093"
rule_files:
- "rules/*.yml"
scrape_configs:
- job_name: "prometheus"
static_configs:
- targets: ["localhost:9090"]
- job_name: "vmware-host"
file_sd_configs:
- files:
# 匹配节点所在的文件
- file_sd/vmware-host.yml
# 检验 yml 文件
[root@VM-64-9-centos prometheus]# ./promtool check config prometheus.yml
Checking prometheus.yml
SUCCESS: 2 rule files found
SUCCESS: prometheus.yml is valid prometheus config file syntax
Checking rules/test-1.yml
SUCCESS: 3 rules found
Checking rules/test-record.yml
SUCCESS: 2 rules found
# 热更新
[root@VM-64-9-centos prometheus]# curl -X POST localhost:9090/-/reload
这时候对于监控 instance 对象来说,没有差别,但是这时我如果将 vmware-host.yml 中的一台去掉,这时候就只剩下一台了1
2
3
4
5[root@VM-64-9-centos prometheus]# cat file_sd/vmware-host.yml
# node 节点监控服务发现配置
- targets:
- 43.153.11.234:9100
#- localhost:9100
这时候不需要刷新 prometheus.yml, 因为文件服务发现,会自动检测文件的变化,基本上可以马上就更新。
也就是这个是自发现的,不需要重启 prometheus 服务
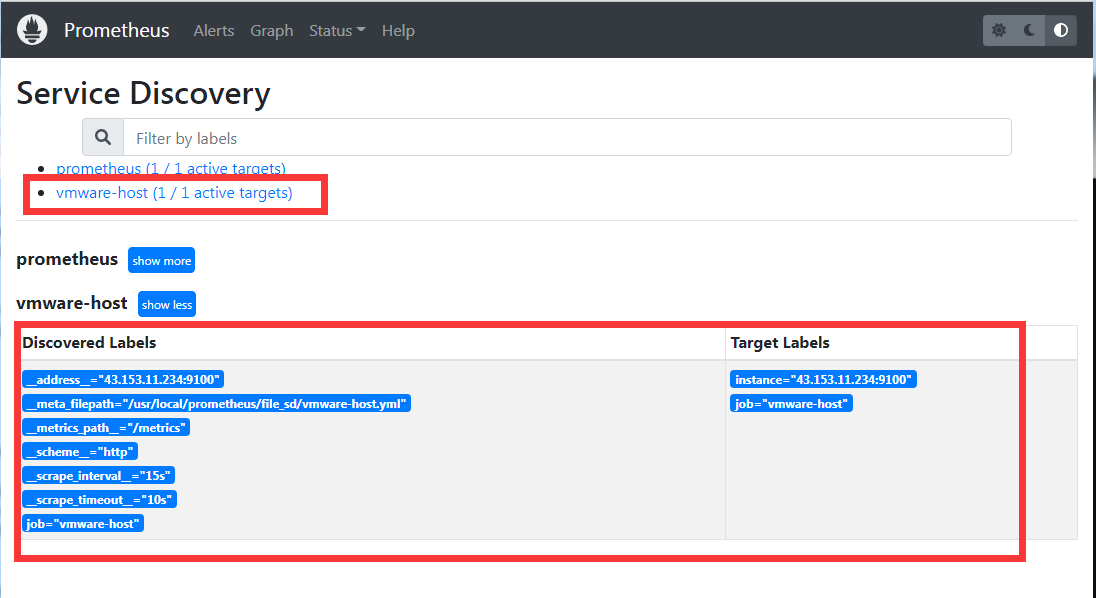
可以看到来源标签:1
__meta_filepath="/usr/local/prometheus/file_sd/vmware-host.yml
说明确实是通过文件服务发现的实例列表,而这个就是文件服务发现的功能了,事实上在生产环境中,因为我们有非常多的实例 instance,而且类型也很多,比如 nginx,mysql,redis,php-fpm 等等,这些服务每一种都有很多台实例。
而就是通过这种文件服务发现的机制,来保证可以根据不同的类型实例来配置不同的配置文件,从而起到切割 prometheus.yml 文件的情况,不然几百上千台的实例全部写在 prometheus.yml 文件中,肯定没办法维护。 所以会采用文件服务发现的方式,将不同类型和 job 的实例单独放文件维护,有几个 job 就几个文件。
http 端点服务发现
http 端点服务发现 和 文件服务发现很像,只不过他不是从本机的某一个文件获取 实例列表,而是远程请求 http 接口得到这一份实例列表
他们俩的对比是:
| 对比项 | 文件服务发现 | http 服务发现 |
|---|---|---|
| 文件变化 | 基于 inotify 特性,自动监控 | 无 |
| 更新频率 | 基于 inotify 特性,自动监控 | 通过 refresh_interval 参数,时间到了,会再去获取, 该参数默认 1 分钟 |
| 支持格式 | Yaml 或者 JSON | JSON |
| 传输 | 本地文件 | HTTP(S) |
| 安全性 | 基于文件的安全 | TLS、基本身份验证、授权标头、OAuth2 |
注意几个细节:
- SD 端点必须使用 HTTP 标头响应 200 并带上头部:
Content-Type: application/json。内容格式为UTF-8。如果不传输任何目标,也必须返回 HTTP 200 状态码,并带有一个空列表[] - 每次抓取都必须返回整个目标列表。不支持增量更新
接下来举个例子,还是用 golang 写一个 demo
1 | package main |
端点返回两个 instance 实例1
2
3
4
5
6
7
8[root@VM-64-9-centos ~]# curl http://localhost:2112/getInstance
[{"targets": ["43.153.11.234:9100"],"labels": {"region": "us-east"}},{"targets": ["localhost:9100"],"labels": {"region": "cn"}}]
[root@VM-64-9-centos ~]# curl -I http://localhost:2112/getInstance
HTTP/1.1 200 OK
Content-Type: application/json
Date: Wed, 14 Dec 2022 10:12:19 GMT
Content-Length: 128
然后配置一下 prometheus.yml,将原先的文件服务发现改成 http 服务发现 (记得重刷 prometheus 配置文件)1
2
3
4
5- job_name: "vmware-host"
http_sd_configs:
- url: http://localhost:2112/getInstance
# 1 分钟检测一次
refresh_interval: 1m
这时候就看到这两台实例
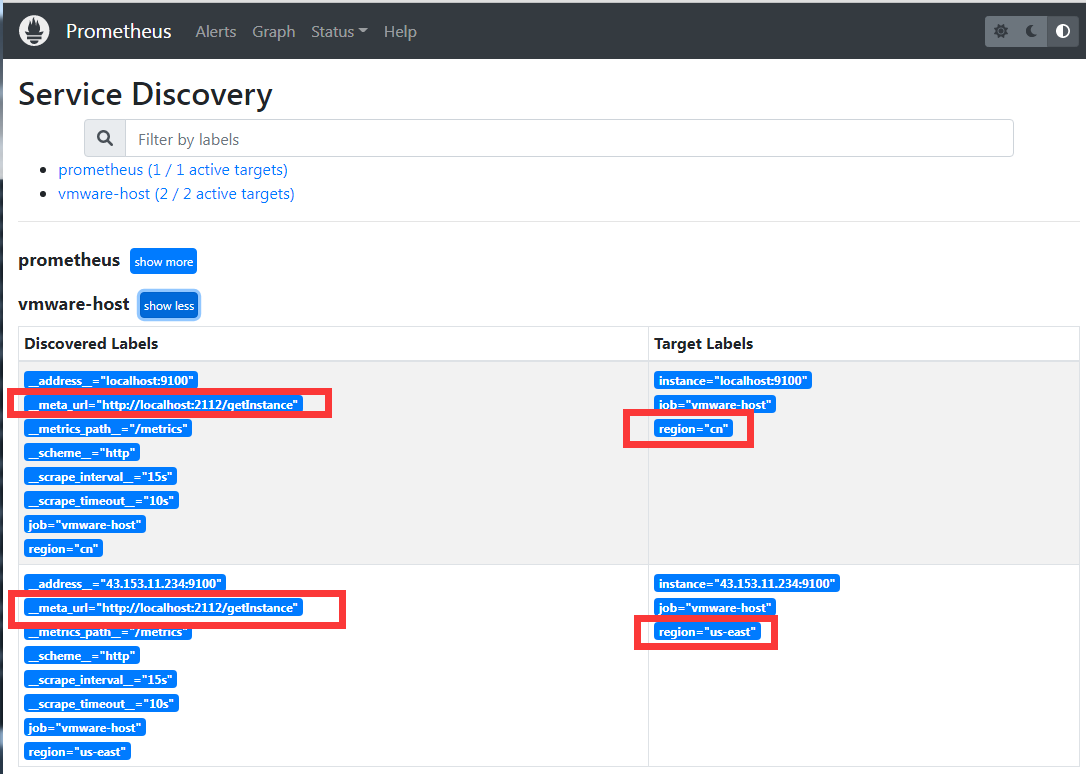
可以看到有一个标签为:1
__meta_url="http://localhost:2112/getInstance"
说明确实是通过 http 服务发现得到的实例列表
参考资料: