前言
通过 基于 prometheus 打造监控报警后台 (3) - 使用 grafana 创建仪表盘 我们已经能够在 grafana 上面创建漂亮的数据监控仪表盘了。
本节我们讲一下怎么在 prometheus 上设置预警并且发送警报。
简单的架构图如下
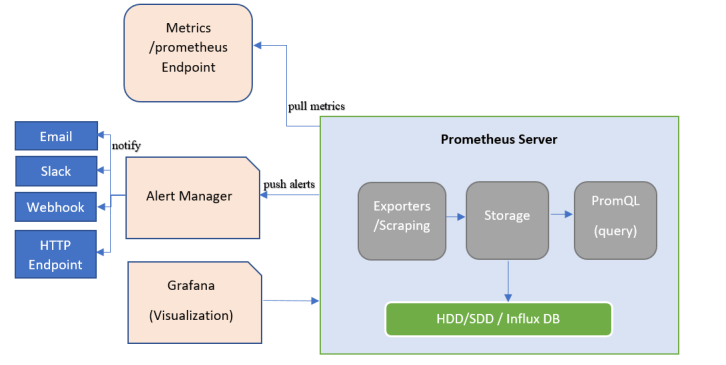
在 prometheus 监控系统中,采集与警报是分离的,所以是分为两个步骤的:
- 在 prometheus 中创建警报规则,并监控警报和触发警报
- 触发警报之后(firing),prometheus 将报警信息转发给独立组件 alertmanager,然后经过 alertmanager 对报警信息处理之后,最后通过接收器发送给指定用户
同时 alertmanager 支持多种接收器(receiver), 比如 Email, Slack , 钉钉, 企业微信 , Webhook
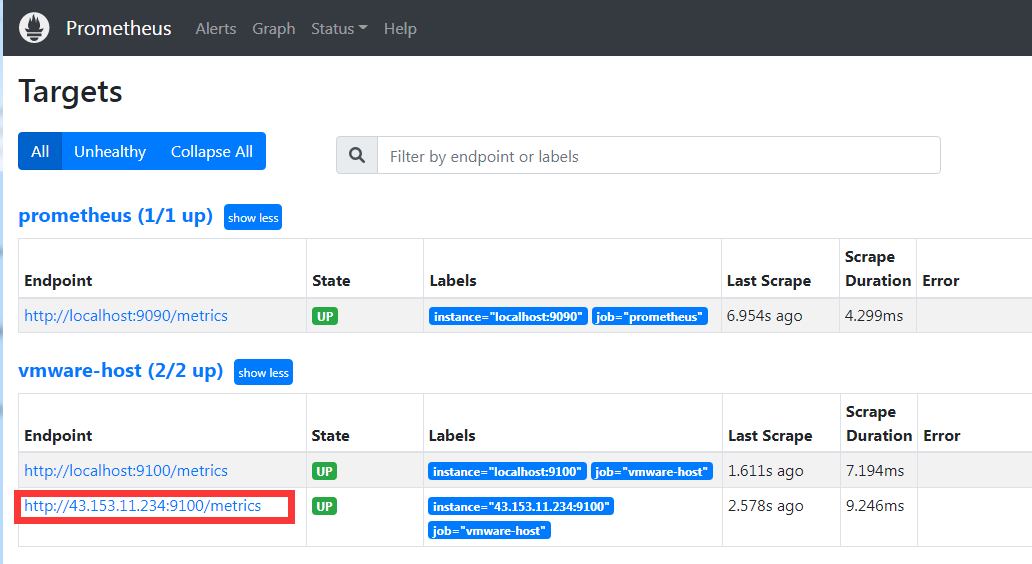
再添加一台 node 节点监控
为了便于后面更好的测试警报, 我这边又在另外的云服务器上添加另一个 node_exporter 监控,对应配置改成:1
2
3
4
5- job_name: "vmware-host"
static_configs:
- targets:
- localhost:9100
- 43.153.11.234:9100
这时候 job vmware-host 就有两台实例主机监控了
创建警报规则
prometheus 可以创建两种规则:
其中 记录规则 不在本次警报章节中,后面会单独开篇章讲述。 本章主要讲的是如何用 警报规则 创建一条警报
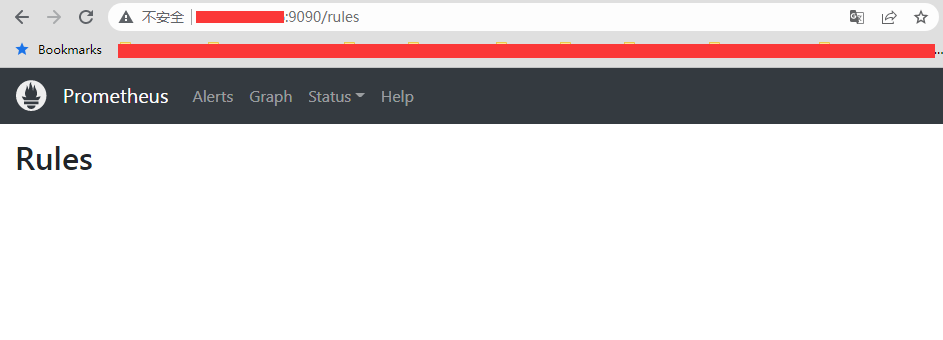
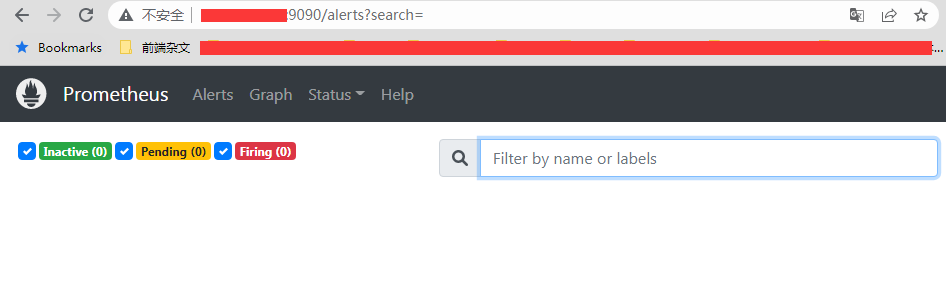
默认情况下,可以在 prometheus 的后台看到,其实并不会有 警报规则,以及对应的 alert 警报
1. 创建一条警报文件
首先就要创建一个警报规则:1
2
3
4
5
6
7
8
9
10
11
12
13
14
15
16
17
18
19
20
21
22
23
24# 先在 prometheus 目录下创建一个 rules 目录,专门用来存放 rules 的 yml 文件
[root@VM-64-9-centos prometheus]# mkdir rules
[root@VM-64-9-centos prometheus]# cd rules
# 接下来创建一个 test-1.yml 的 rule 文件, 使用 YAML 文件格式
# 里面包含一条警报规则,就是监控 node 的节点存活
[root@VM-64-9-centos rules]# cat test-1.yml
# rules/test-1.yml
groups:
- name: test-1
rules:
- alert: 节点存活
expr: up{job="vmware-host"} == 0
for: 1m
labels:
level: critical
annotations:
summary: "机器 {{ $labels.instance }} 挂了"
description: "{{$labels.instance}} 宕机(当前值: {{ $value }})
# 接下来使用工具检查 test-1.yml 的格式是否正常,一样用 promtool 检查
[root@VM-64-9-centos prometheus]# ./promtool check rules rules/test-1.yml
Checking rules/test-1.yml
SUCCESS: 1 rules found
这样子就创建了一个警报规则文件叫做 test-1.yml, 里面包含了一条警报规则,名称叫做 节点存活, 并且有使用 promtool 工具有校验 rule 文件格式是正确的(如果格式不正确,将无法应用)。
关于检查格式,如果 rules 目录下有多个规则文件,那么可以这样子一次性检查
./promtool check rules rules/*.yml所有文件
一个规则文件里面可以包含多个警报规则,可以写在同一组 group 里面的 rules 下面,也可以单独写在另一个 group 中。
为了使告警信息具有更好的可读性,prometheus 支持使用变量来获取指定标签中的值。比如 $labels.<labelname> 变量可以访问当前告警实例中指定标签的值。$value 可以获取当前 PromQL 表达式计算的样本值。
2. 将警报规则添加到 prometheus 配置文件中
在 prometheus 文件中,添加 rule_files 这个节点,其他不变1
2
3
4
5
6
7
8
9
10
11
12
13
14
15
16
17
18
19
20
21
22
23
24
25
26
27
28
29
30
31# 编辑 prometheus.yml 添加 rule_files 节点,指定对应位置的警报规则文件
[root@VM-64-9-centos prometheus]# cat prometheus.yml
global:
scrape_interval: 15s
evaluation_interval: 15s
rule_files:
- "rules/test-1.yml"
scrape_configs:
- job_name: "prometheus"
static_configs:
- targets: ["localhost:9090"]
- job_name: "vmware-host"
static_configs:
- targets:
- localhost:9100
- 43.153.11.234:9100
# 验证配置文件是否格式正确 (连同 rules 文件一起验证)
[root@VM-64-9-centos prometheus]# ./promtool check config prometheus.yml
Checking prometheus.yml
SUCCESS: 1 rule files found
SUCCESS: prometheus.yml is valid prometheus config file syntax
Checking rules/test-1.yml
SUCCESS: 1 rules found
# 重新加载配置文件,让 rules 文件生效
[root@VM-64-9-centos prometheus]# curl -X POST localhost:9090/-/reload
这边如果有多个 rules 文件要应用的话,可以这样子写1
2rule_files:
- "rules/*.yml"
或者这样子写:1
2
3rule_files:
- "rules/test-1.yml"
- "rules/test-2.yml"
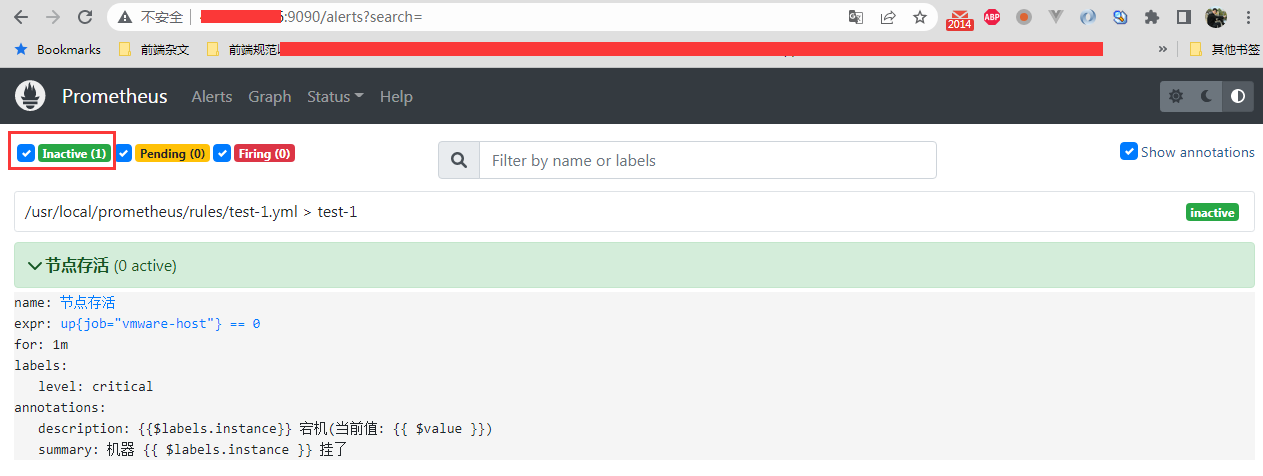
接下来就可以看到在 prometheus 的后台上, rules 和 alerts 都有值了

可以看到出现了一个 group 为 test-1 的警报规则组, 里面有一条警报,名称为 节点存活
alerts 那边也可以看到确实存在一个警告了, 但是处于 未激活的 inactive 状态, 这个说明当前状态是正常的
3. 警报规则参数
关于 rules 文件的参数配置,可以参照官方的文档: rules configuration
记录规则 和 警报规则 的配置差别仅仅在于
rules小节下的第一个配置的 key 是 record 还是 alert。 其他都一样
整个 rule 文件是以一个 groups 规则组开头的:1
2groups:
[ - <rule_group> ]
里面可以包含各个规则组,记录规则 和 警报规则都可以写一起。 然后每一个组 rule_group 的参数如下:1
2
3
4
5
6
7
8
9
10
11
12# 组名
name: <string>
# 规则评估间隔,没有设置就默认吃 prometheus 配置文件的这个 global.evaluation_interval 值
[ interval: <duration> | default = global.evaluation_interval ]
# 限制可触发警报数量,默认 0 表示不限制
# 如果有设置的话,一旦由该组规则触发的警报大于这个值,之后将不会触发这个规则引起的警报
[ limit: <int> | default = 0 ]
rules:
[ - <rule> ... ]
接下来就是单个 rule 的配置, 分两种语法,一种是记录规则,一种是警报,我们本次只讲警报规则配置。1
2
3
4
5
6
7
8
9
10
11
12
13
14
15
16
17
18
19# 警报规则的名称
alert: <string>
# 评估执行的 PromQL 语法表达式,结果应该是 true 或者 false
# 如果为 true,那么就会触发警报,警报的状态就会从 inactive 的未激活,转换为 pending 或者 firing
expr: <string>
# 等待期,一旦规则警报被触发之后,会变成 pending 中间态,这时候就会进入等待期
# 如果等待期内,该规则警报没有重新变成正常(也就是在这期间的评估结果有一次 expr 的执行结果为 false, 状态就会变成 inactive 的正常态), 状态就会变成结束态的 firing。 然后 prometheus 就会将这个警报发送给 alertmanager
# 如果为 0 的话,将直接跳过 pending 状态,一旦评估的 expr 为 true,那么马上变成 firing 状态
[ for: <duration> | default = 0s ]
# 警报标签,可自己定制,这个添加的标签,可以被模板提取出来
labels:
[ <labelname>: <tmpl_string> ]
# 警报的注释,用于描述,比如后面发送邮件 或者 钉钉通知的话,用得着,也可以被模板提取出来
annotations:
[ <labelname>: <tmpl_string> ]
这边需要注意的是, for 这个参数,一般我们不希望偶尔的网络波动导致 prometheus 抓取数据失败,就会马上触发警报(firing 状态),从而就收到警报邮件了,因此我们就会设置一个比较合理的等待值。 在等待周期之内,如果触发评估规则了,并且 expr 表达式为 false,那么就会将状态变成 inactive,这时候就不会触发警报了
这个值要大于评估周期 evaluation_interval 才有价值,比如评估周期是 15s, 然后 for 设置的是 20s,然后触发顺序是这样子:
- 触发评估周期,然后执行 expr 表达式,为 true, 警报状态从
inactive变成pending, 进入等待期(执行 for 子句) - 过了 15s,又触发评估周期,执行 expr 表达式,这时候就有两种情况:
2.1 执行结果为 true,但是还没有到 for 的 20s,继续保持 pending 状态,然后又过了 5s,for 的等待期结束,状态从pending变成firing, 触发警报, prometheus 将这个警报扔给 alertmanager 处理
2.2 执行结果为 false,警报状态从pending变成inactive, 警报恢复正常,重新等待下一轮评估
所以我们刚才的那个配置,其实就是我们有一个叫做 test-1 的规则警报组,里面有一条警报叫 节点存活, 评估周期是 15s, 抓取周期是 15s,等待周期是 1 分钟,然后判断的表达式是 up{job="vmware-host"} == 0
4. 警报的状态
prometheus 警报有 4 种状态:
- inactive -> 非活动状态,表示正在监控,但是还未有任何警报触发
- pending -> 警报被触发,但是在等待期内,如果等待期内没有恢复正常,就会转化为 firing
- firing -> 结束态,警报已经触发,prometheus 将按照配置将报警信息发送给 alertmanager
- resolve -> 恢复态,如果是 firing 状态,后面又恢复正常,警报又会重新变成 inactive。 这时候 prometheus 就会发送一个 resolve 的恢复态给 alertmanager,让 alertmanager 发送报警恢复邮件 (假设有配置的话)
虽然以上有 4 种,但是对于 prometheus 的警报来说, 只有前三种,因为对于状态显示来说, 第四种的恢复态,其实就是第一种的 inactive。 也就是只有 alertmanager 才需要恢复态
所以对于 alertmanager 的警报来说,只有两种状态: firing 和 resolve, 因为 prometheus server 传递给 alertmanager 的状态就只有这两个状态
5. 抓取周期(scrape_interval) 和 评估周期 (evaluation_interval)
在 prometheus server 中, 抓取周期 和 评估周期是分开的,可以各自设置。 但是最好评估周期要 大于等于 抓取周期。 不能小于, 不然就会出现评估的时候,取的是旧值,导致误报。
举个例子,假设抓取周期是 2 分钟, 然后评估周期是 15s, 等待周期是 1m,这时候就会出现这种情况:
- 第一次抓取的时候,节点挂了, up 为 0
- 15s 后触发评估周期,发现节点挂了,状态变成 pending, 启动等待周期 1m
- 又过了 10s,节点启动正常
- 又过了 5s,触发第二次评估,但是因为还没有触发抓取周期,评估的数据还是旧的,所以判断还是 pending
- 又过了 45s,期间触发了 3 轮的评估,因为都是旧值,同时因为过了等待周期,状态变为 firing,触发报警
- 又过了一分钟, 触发抓取周期,节点正常,同时时间周期也触发了评估周期,表达式返回 false, 状态从 firing 变成 inactive,警报恢复正常
以上就会有误报的情况。
所以再有等待期(for 不为 0)的情况下,其实就是 for 等待周期 >= 评估周期 >= 抓取周期
6. 操作触发警报
我们将 prometheus 这一台的 node_exporter 节点服务停止1
[root@VM-64-9-centos prometheus]# systemctl stop node_exporter.service
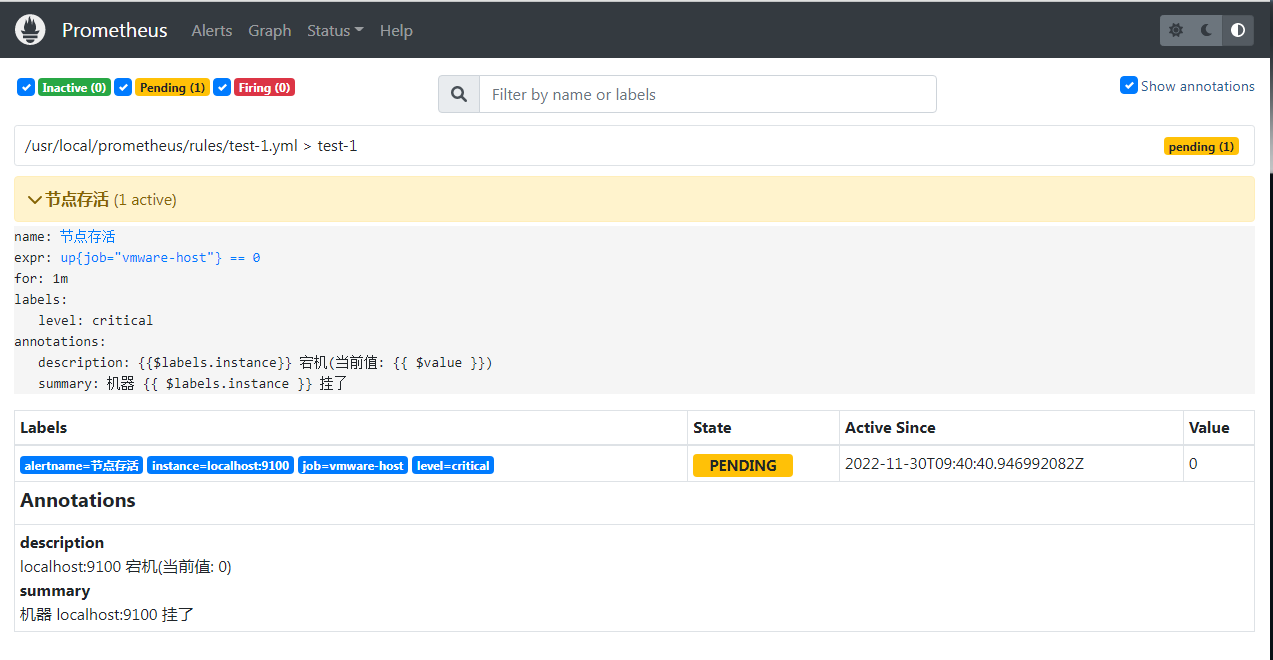
因为抓取周期和评估周期是 15s,所以这时候就可以看到 alert 状态变成 pending 了
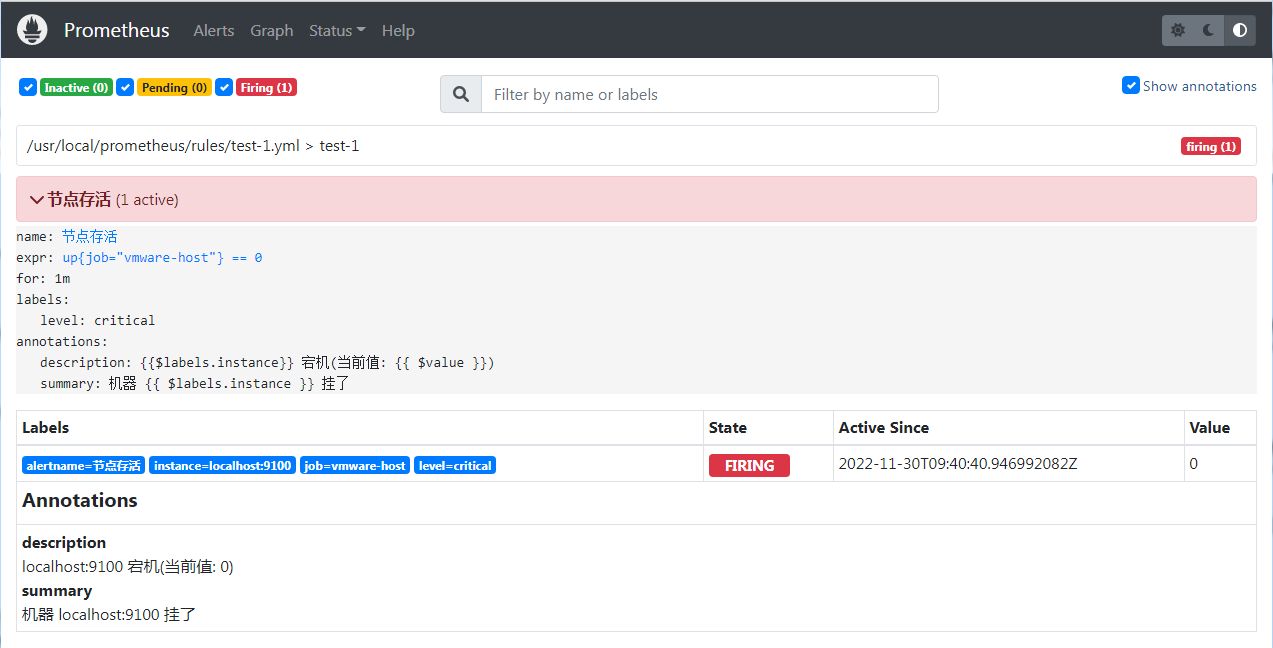
然后过了一分钟之后,过了等待期,彻底变成 firing 了
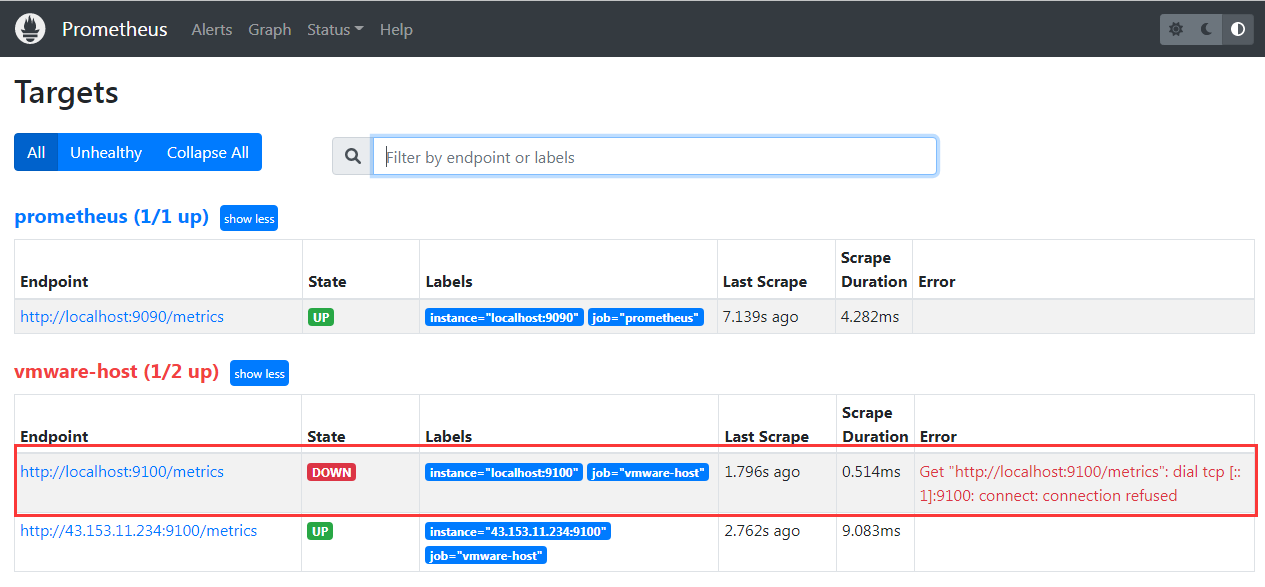
同时实例监控这边,会有显示有一个节点 down 了
接下来我们将这个 node_exporter 重新启动,可以看到一旦到新一轮的评估周期,就会变成正常的 inactive
接下来也试过先关掉服务,然后再过了等待期之前,再开启服务,这时候只要新一轮的评估周期在等待期内,一样会从 pending 变成 inactive,不会触发 firing
7. 警报规则的单元测试
我们可以用 promtool 来对警报规则进行单元测试: 具体可以看官方文档: 规则的单元测试
alertmanager
我们已经能够从 prometheus server 中创建警报规则,并成功触发警报了, 但是我们还缺少触发之后的报警手段,比如发送 mail 到运维人员之类的手段
1. 安装
而这个就是 alertmanager 所要做的功能。 alertmanager 是一个独立的服务,因为我们要单独安装, 下载地址: download, 一样采用二进制包的方式安装1
2
3
4
5
6
7
8
9
10
11
12
13
14
15
16
17
18
19
20
21
22
23
24
25
26
27
28
29
30
31
32
33# 下载解压,重命名
[root@VM-64-9-centos ~]# cd /usr/local/
[root@VM-64-9-centos local]# wget https://github.com/prometheus/alertmanager/releases/download/v0.24.0/alertmanager-0.24.0.linux-amd64.tar.gz
[root@VM-64-9-centos local]# tar zxf alertmanager-0.24.0.linux-amd64.tar.gz
[root@VM-64-9-centos local]# mv alertmanager-0.24.0.linux-amd64 alertmanager
# 指定 owner
[root@VM-64-9-centos local]# chown root.root alertmanager -R
# 创建 system 启动脚本
[root@VM-64-9-centos local]# cat /usr/lib/systemd/system/alertmanager.service
[Unit]
Description=Alertmanager
Documentation=https://prometheus.io/
After=network.target
[Service]
Type=simple
ExecStart=/usr/local/alertmanager/alertmanager --config.file=/usr/local/alertmanager/alertmanager.yml
ExecStop=/bin/kill -s QUIT $MAINPID
Restart=on-failure
[Install]
WantedBy=multi-user.target
# 设置开机自启动,并启动服务
[root@VM-64-9-centos local]# systemctl daemon-reload
[root@VM-64-9-centos local]# systemctl enable alertmanager
[root@VM-64-9-centos local]# systemctl start alertmanager
# 查看服务
[root@VM-64-9-centos local]# netstat -anlp | grep alert
tcp6 0 0 :::9093 :::* LISTEN 601/alertmanager
这样子就安装好了,alertmanager 有自己的查看后台, http://ip:9093
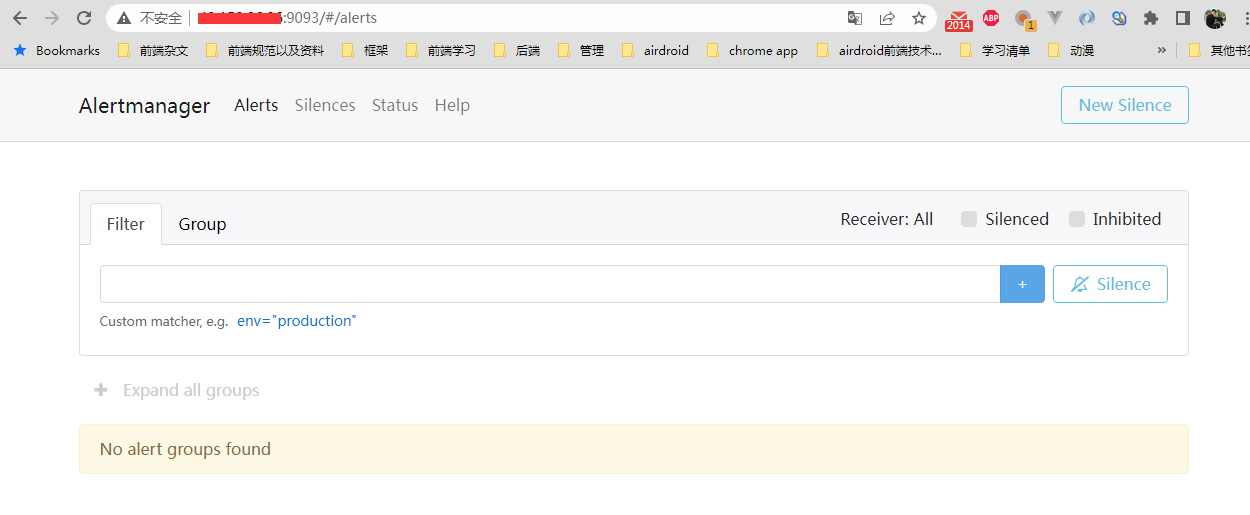
可以看到,因为刚安装,也没有关联 prometheus, 所以没有警报信息
2. 设置配置文件
接下来我们配置一下配置文件,默认的配置文件是这样子的,在1
2
3
4
5
6
7
8
9
10
11
12
13
14
15
16
17[root@VM-64-9-centos alertmanager]# cat /usr/local/alertmanager/alertmanager.yml
route:
group_by: ['alertname']
group_wait: 30s
group_interval: 5m
repeat_interval: 1h
receiver: 'web.hook'
receivers:
- name: 'web.hook'
webhook_configs:
- url: 'http://127.0.0.1:5001/'
inhibit_rules:
- source_match:
severity: 'critical'
target_match:
severity: 'warning'
equal: ['alertname', 'dev', 'instance']
配置了以下规则:
- 配置了几个时间设置间隔
- 配置了分组方式(根据标签名
alertname来分组) - 配置了 webhook 的接收者,方式是发送 webhook endpoint api
- 配置抑制(
inhibit_rules)规则
我们稍微改造一下,改成用 mail 来做接收者。 具体改为
1 | # 编辑调整 |
其实就是去掉了抑制配置,将接收者改成 mail 邮箱,同时增加了 mail 配置,其他都不变。
关于怎么用 qq 邮箱配置 smtp 邮箱服务,可以看我之前的文章: bug 追踪系统 Sentry (2) -- 账号初始化和邮件发送配置
二进制包安装的目标目录下有自带一个 yml 文件校验工具 amtool, 可以用它来校验 alertmanager 的配置文件是否格式正确
事实上, amtool 不仅仅是校验工具怎么简单,他还是一个可以配置 alertmanager 的 cli 命令工具, 感兴趣的可以看官方文档: amtool
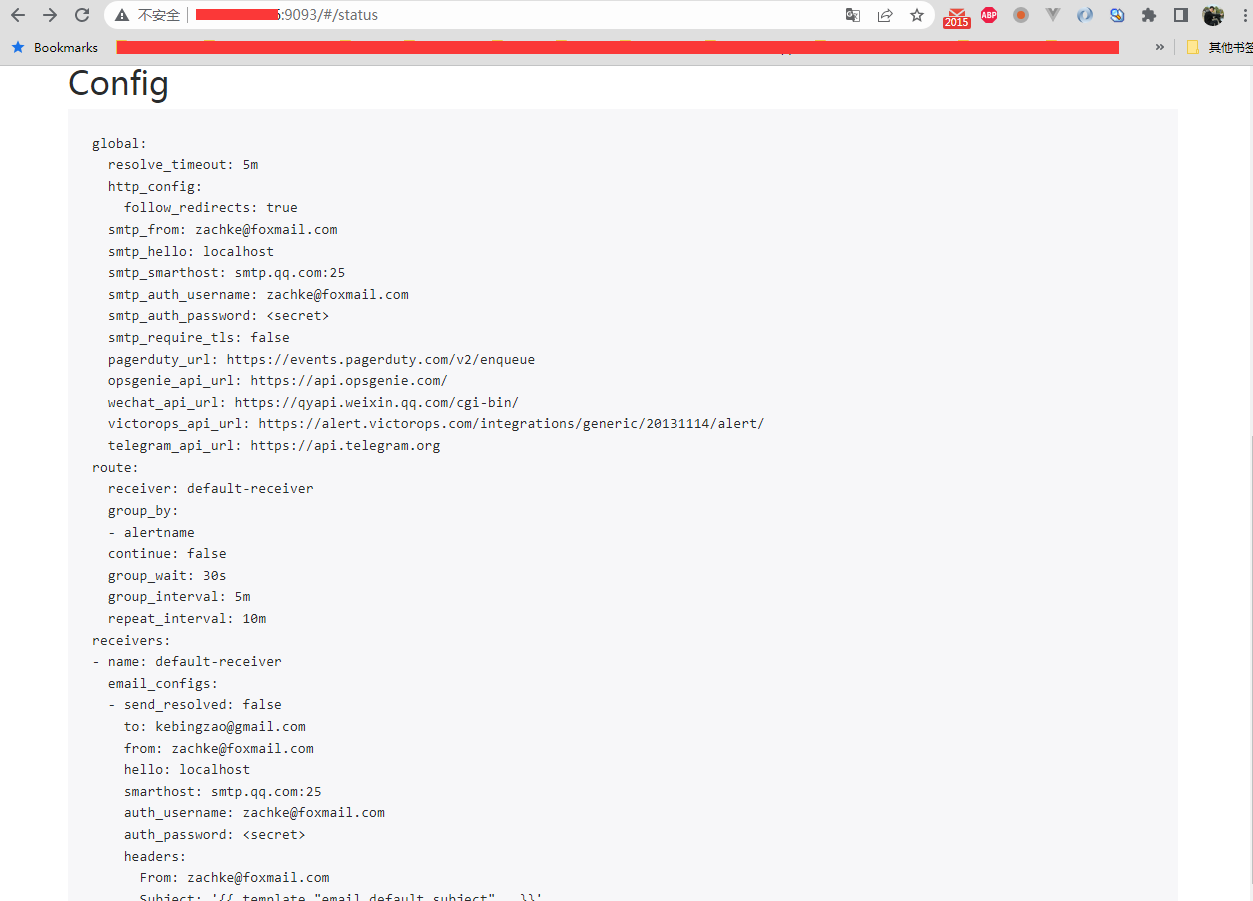
上面的 yml 文件配置其实是有一些缺省默认值的,具体看完整的配置,我们可以在 alertmanager 后台的 status 查看: http://ip:9093/#/status
后面会讲到这些配置项的含义
3. prometheus 关联 alertmanager
接下来就要在 prometheus 管理 alertmanager 服务了,加 alerting 这个节点就行了,其他不变1
2
3
4
5
6
7
8
9
10
11
12
13
14
15
16
17
18
19
20
21
22
23
24
25
26
27
28
29
30
31
32
33
34
35
36
37# 添加 alerting 小节,将 alertmanager 服务加上去
[root@VM-64-9-centos prometheus]# cat prometheus.yml
global:
scrape_interval: 15s
evaluation_interval: 15s
alerting:
alertmanagers:
- static_configs:
- targets:
- "localhost:9093"
rule_files:
- "rules/test-1.yml"
scrape_configs:
- job_name: "prometheus"
static_configs:
- targets: ["localhost:9090"]
- job_name: "vmware-host"
static_configs:
- targets:
- localhost:9100
- 43.153.11.234:9100
# 检查语法
[root@VM-64-9-centos prometheus]# ./promtool check config prometheus.yml
Checking prometheus.yml
SUCCESS: 1 rule files found
SUCCESS: prometheus.yml is valid prometheus config file syntax
Checking rules/test-1.yml
SUCCESS: 1 rules found
# 更新配置文件
[root@VM-64-9-centos prometheus]# curl -X POST localhost:9090/-/reload
4. 测试警报发送
接下来我们测试警报发送, 将 prometheus server 这一台的 node_exporter 服务关闭:1
systemctl stop node_exporter.service
接下来可以看到,警报名称为 节点存活 的状态变化 inactive -> pending -> firing
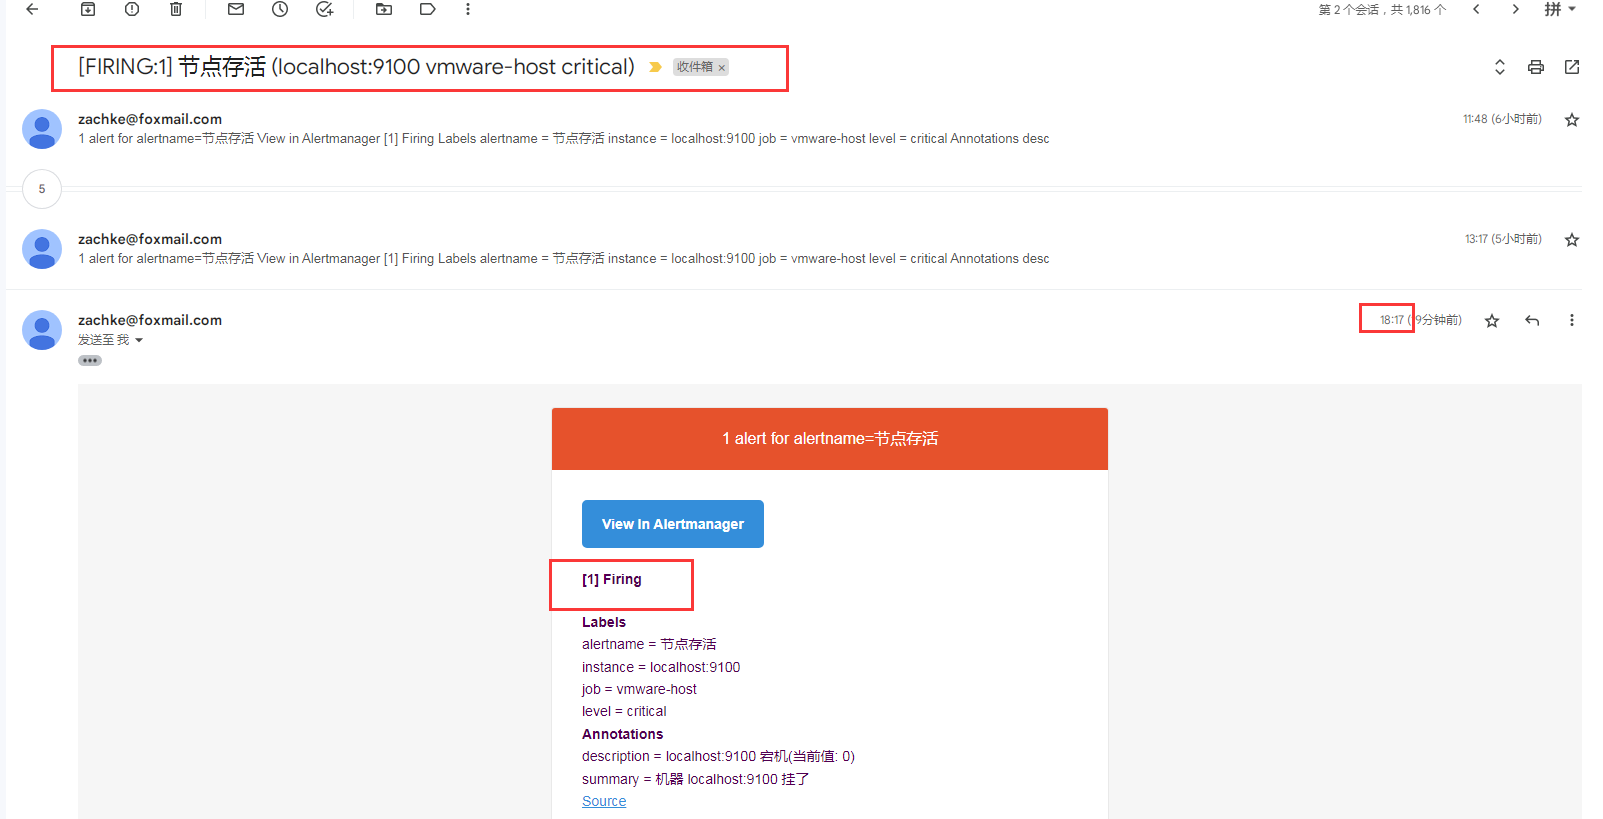
当变成 firing 的时候,这时候 alertmanager 就会接收到这一台报警消息,这时候就可以收到这一封报警邮件了
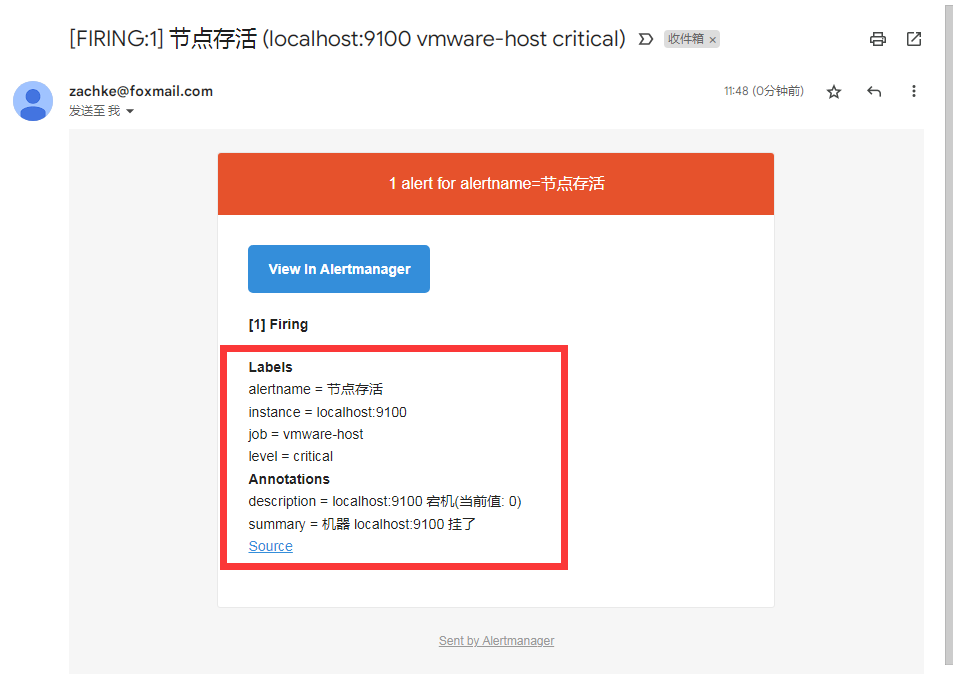
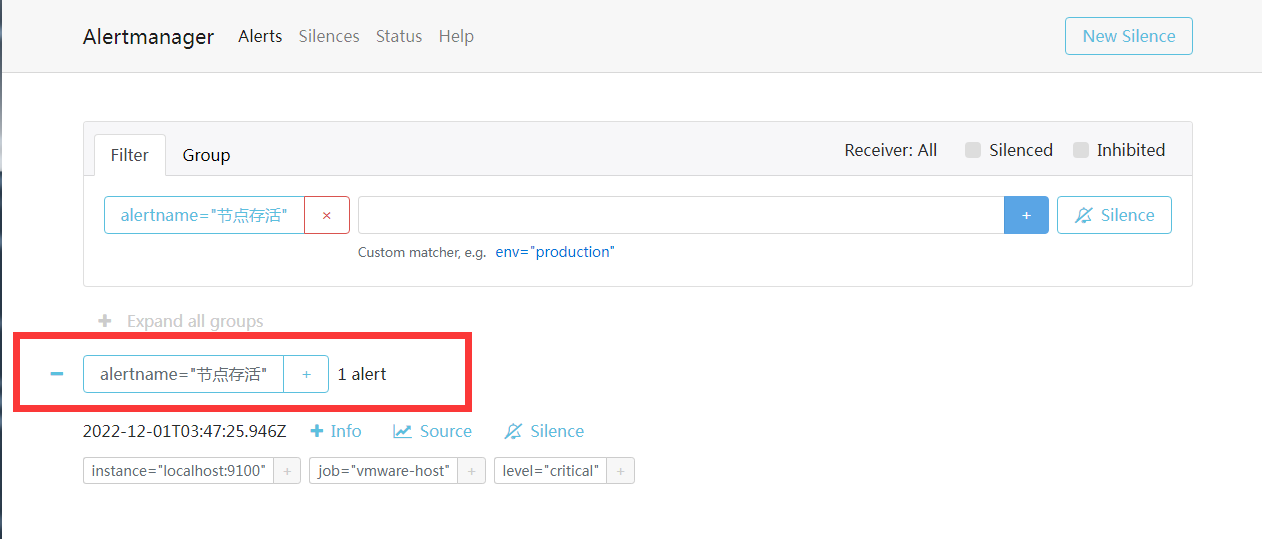
同时在 alertmanager 后台,我们也可以看到有触发这个警报了
因为没有设置邮件模板,所以他用的是 alertmanager 的默认的模板, 所以没有明确在 yml 文件配置,但是补上这些默认的缺省值的话, receivers 这一块邮箱的配置应该是:1
2
3
4
5
6
7
8
9
10
11
12
13
14
15
16
17receivers:
- name: default-receiver
email_configs:
- send_resolved: false
to: k****o@gmail.com
from: z***e@foxmail.com
hello: localhost
smarthost: smtp.qq.com:25
auth_username: z***e@foxmail.com
auth_password: <secret>
headers:
From: z***e@foxmail.com
Subject: '{{ template "email.default.subject" . }}'
To: k****o@gmail.com
html: '{{ template "email.default.html" . }}'
require_tls: false
templates: []
5. 配置文件参数解析
接下来我们详细讲一下 alertmanager 的 yml 配置文件的相关配置参数,一样直接参照官方配置文档: alertmanager 配置文档
这边参照的是当前最新的
0.24版本,后面如果版本有继续迭代,可能会出现有些参数不一样
关于 alertmanager 的配置文件的配置,官方也有提供了 example 参考: alertmanager simple.yml
5.1. global
配置文件,一样分为 7 个小节:1
2
3
4
5
6
7
8
9
10
11
12
13
14
15
16
17
18
19
20
21
22
23
24
25
26
27
28
29
30
31
32
33
34
35
36
37
38
39
40
41
42
43
44
45
46
47
48
49
50
51
52
53
54
55
56
57
58# 全局配置,有些可被下面的具体配置替换
global:
# smtp 相关的邮箱发送配置
# 邮件发送来源,很多时候要跟 username 的发送邮箱同一个
[ smtp_from: <tmpl_string> ]
# smtp 协议的发送端点
[ smtp_smarthost: <string> ]
# 定义的主机名称 (hostname)
[ smtp_hello: <string> | default = "localhost" ]
# 登录的用户名和密码,以及对应的一些加密协议
[ smtp_auth_username: <string> ]
[ smtp_auth_password: <secret> ]
[ smtp_auth_identity: <string> ]
[ smtp_auth_secret: <secret> ]
# 是否启用 tls 加密,默认启用
[ smtp_require_tls: <bool> | default = true ]
# 一些第三方的 receivers 配置
[ slack_api_url: <secret> ]
[ slack_api_url_file: <filepath> ]
[ victorops_api_key: <secret> ]
[ victorops_api_url: <string> | default = "https://alert.victorops.com/integrations/generic/20131114/alert/" ]
[ pagerduty_url: <string> | default = "https://events.pagerduty.com/v2/enqueue" ]
[ opsgenie_api_key: <secret> ]
[ opsgenie_api_key_file: <filepath> ]
[ opsgenie_api_url: <string> | default = "https://api.opsgenie.com/" ]
[ wechat_api_url: <string> | default = "https://qyapi.weixin.qq.com/cgi-bin/" ]
[ wechat_api_secret: <secret> ]
[ wechat_api_corp_id: <string> ]
[ telegram_api_url: <string> | default = "https://api.telegram.org" ]
# http 客户端配置,允许配置接收方用来与基于 HTTP 的 API 服务通信的 HTTP 客户端
[ http_config: <http_config> ]
# 如果超过这个时间段,prometheus 那边没有给出警报的状态更新,alertmanager 就默认这个警报已经解决
# 对于 alertmanager 来说,哪怕 prometheus 一直给 firing 状态,那也是警报有新的状态更新
# 一定是要那种没有任何状态值给过来的,比如 prometheus server 挂了,或者 rules 警报规则被删除了这种
[ resolve_timeout: <duration> | default = 5m ]
# 模板文件目录
# 警报模板可以自定义通知的信息格式,以及其包含的对应警报指标数据,可以自定义Email、企业微信的模板,配置指定的存放位置
templates:
[ - <filepath> ... ]
# 警报的路由树
route: <route>
# 警报通知接收者配置
receivers:
- <receiver> ...
# 抑制规则配置
inhibit_rules:
[ - <inhibit_rule> ... ]
# 静音/激活 的时间间隔的一组数据
# 他配置的时间点和名称,要匹配 route 节点下的 mute_time_intervals 或者 active_time_intervals
time_intervals:
[ - <time_interval> ... ]
具体的描述,官方文档写的很清楚了, 接下来主要看这个 route 节点的配置
5.2. route
警报路由节点(route) 描述了在收到 prometheus 生成的警报后,将警报信息发送给接收器 receiver 指定的目标地址规则。 alertmanager 对传入的警报信息进行处理,根据所定义的规则与配置进行匹配。
对于路由可以理解为树状结构,设置的第一个 route 是 root route,往下的就是包含的子节点(子节点的可配置参数跟根节点一样),每个警报传进来以后,会从配置的跟节点路由进入路由树,按照深度优先从左向右遍历匹配,当匹配的节点后停止,进行警报处理。1
2
3
4
5
6
7
8
9
10
11
12
13
14
15
16
17
18
19
20
21
22
23
24
25
26
27
28
29
30
31
32
33
34
35
36
37
38
39
40
41
42# 接收器名称,如果下面的子 route 节点没有匹配到,就采用这个默认的接收器
# 如果没有设置子节点,也是用这个
[ receiver: <string> ]
# 根据 prometheus 的 lables 进行报警分组,这些警报会合并为一个通知发送给接收器,也就是警报分组。
# 后面关于 alertmanager 的分组特性,会单独挑一个小篇幅来实践
[ group_by: '[' <labelname>, ... ']' ]
# 警报是否应继续匹配后续的兄弟节点,默认为 false, 即一旦匹配上,就采用当前这个,不再继续匹配
[ continue: <boolean> | default = false ]
# 一组匹配规则,通过正则表达式来匹配
matchers:
[ - <matcher> ... ]
# 设置从接受警报到发送的等待时间,若在等待时间中group接收到新的警报信息,这些警报会合并为一条发送
[ group_wait: <duration> | default = 30s ]
# 此设置控制的是 group 之间发送警报通知的间隔时间
[ group_interval: <duration> | default = 5m ]
# 此设置控制的是警报发送成功以后,没有对警报做解决操作的话,状态 Firing 没有变成 Inactive 或者 Pending ,会再次发送警报的的间隔时间。
[ repeat_interval: <duration> | default = 4h ]
# 路由应该静音的时间段
# root route 不设置这个,一般在 routes 树下面的子 route 节点设置
# 如果有配置的话,那么在静音期间,哪怕 prometheus 发送警报过来, alertmanager 也不会发送警报通知
# 他的值是一个 string,也就是上述 time_intervals 所配置的时间段所设置的 name
mute_time_intervals:
[ - <string> ...]
# 路由应该处于活动状态的时间段,默认的空值代表始终处于活动状态,
# root route 不设置这个,一般在 routes 树下面的子 route 节点设置
# 只有处于活动状态的时候,alertmanager 才会发送警报通知
# 他的值是一个 string,也就是上述 time_intervals 所配置的时间段所设置的 name
# 比如我如果只想在 周一到周五 才想收到邮件, 那么就可以配置这个, 后面会有例子
active_time_intervals:
[ - <string> ...]
# 匹配路由树,上面的每一个 route 配置就跟 root route 配置一样
routes:
[ - <route> ... ]
上面的配置有点抽象,我们可以用一个例子说一下:1
2
3
4
5
6
7
8
9
10
11
12
13
14
15
16
17
18
19
20
21
22
23
24
25
26
27
28
29
30
31
32
33
34
35
36
37
38
39
40
41
42
43
44
45
46# root route 节点
route:
# 默认接收器
receiver: 'default-receiver'
# 收到警报后,如果在 30s 内还有其他同组的报警,那么就合并成一条报警通知
group_wait: 30s
# 收到警报后,判断上一条同一组的警报是否是 5 分钟之前,如果是之前,那么等待上述的 30s 过后,就立马发送
# 如果上一条同组的发送间隔还不足 5 分钟,这时候就等间隔达到了 5 分钟,再发送
group_interval: 5m
# 发送警报间隔,如果 4h 之后,该警报还是没有修复,哪怕警报内容重复,也要再次发送报警通知
repeat_interval: 4h
# 分组依据,根据 prometheus 的 labels 进行报警分组
# 以下标签中,根据 cluster 和 alertname 这两个的值来分组
group_by: [cluster, alertname]
# 子路由节点
routes:
# 组内等待时间 10s,并且警报的 service 标签是 mysql 或者 cassandra 的警报,那么他的接收者是 database-pager
- receiver: 'database-pager'
group_wait: 10s
matchers:
- service=~"mysql|cassandra"
# 匹配 team="frontend", 那么就按照 product 和 environment 这两个标签的值来分组,并且设置接收者是 frontend-pager
- receiver: 'frontend-pager'
group_by: [product, environment]
matchers:
- team="frontend"
# 匹配 service="inhouse-service" 标签,并且在下班时间和节假日时间是静音,不发送通知给接收者 dev-pager
# 同时继续往下匹配
- receiver: 'dev-pager'
matchers:
- service="inhouse-service"
mute_time_intervals:
- offhours
- holidays
continue: true
# 匹配 service="inhouse-service" 标签, 并且只有在下班时间和节假日才会生效,如果生效,就发送给 on-call-pager 接收者
# 简单的来说,如果是下班时间和节假日的警报,那么普通预警比如发邮件之类的不够, 采用打电话之类的预警
- receiver: 'on-call-pager'
matchers:
- service="inhouse-service"
active_time_intervals:
- offhours
- holidays
简单的来说,路由匹配的执行步骤如下:
- 先判断警报的 service 标签是 mysql 或者 cassandra,如果是就给接收者 database-pager,然后结束, 同时继承 root route 的 group by,按照 cluster 和 alertname 这两个标签的值来分组
- 如果不是,匹配 team=”frontend”, 同时按照 product 和 environment 这两个标签的值来分组 (重写了 root route 的 group by),抛给接收者 frontend-pager,然后结束
- 如果还不是,匹配 service=”inhouse-service” 标签,然后分为两种
3.1 如果当前不是下班时间和节假日时间,那么就通知给接收者 dev-pager,然后继续匹配到下一条规则,有匹配到但是因为不满足 下班时间和节假日 的激活时间,不发送给接收者 on-call-pager
3.2 如果当前是下班时间和节假日时间,那么当前是静音状态,不发送接收者 dev-pager,然后继续匹配到下一条规则,有匹配到,同时满足激活条件,发送给接收者 on-call-pager - 如果都不匹配,发送给默认的接收者 default-receiver
5.3. time_intervals
其中 offhours 和 holidays 这两个 time_intervals 是要在上述的子节点 time_intervals 配置的,比如这样子:1
2
3
4
5
6
7
8
9time_intervals:
- name: holidays
time_intervals:
- weekdays: ['saturday', 'sunday']
- name: offhours
time_intervals:
- times:
- start_time: 18:00
end_time: 24:00
以上的时区都是 UTC 时区,目前不支持其他时区
5.4. receiver
接受器是一个统称,每个 receiver 都有需要设置一个全局唯一的名称,并且对应一个或者多个通知方式,包括 email 、微信、 Slack 、钉钉等。
接下来我们看一下接收者 (receiver) 的配置1
2
3
4
5
6
7
8
9
10
11
12
13
14
15
16
17
18
19
20
21
22
23
24# The unique name of the receiver.
name: <string>
# Configurations for several notification integrations.
email_configs:
[ - <email_config>, ... ]
opsgenie_configs:
[ - <opsgenie_config>, ... ]
pagerduty_configs:
[ - <pagerduty_config>, ... ]
pushover_configs:
[ - <pushover_config>, ... ]
slack_configs:
[ - <slack_config>, ... ]
sns_configs:
[ - <sns_config>, ... ]
victorops_configs:
[ - <victorops_config>, ... ]
webhook_configs:
[ - <webhook_config>, ... ]
wechat_configs:
[ - <wechat_config>, ... ]
telegram_configs:
[ - <telegram_config>, ... ]
上面配置很多个, 我们一般只用这几个: email, 钉钉, webhook
其中 钉钉 是又是基于 webhook 的
5.4.1 email_config
邮件的配置如下:1
2
3
4
5
6
7
8
9
10
11
12
13
14
15
16
17
18
19
20
21
22
23
24
25
26
27
28
29
30
31
32
33
34
35# 警报状态恢复是否要发送恢复邮件
[ send_resolved: <boolean> | default = false ]
# 发送对象邮箱
to: <tmpl_string>
# 发送者邮箱
[ from: <tmpl_string> | default = global.smtp_from ]
# The SMTP host
[ smarthost: <string> | default = global.smtp_smarthost ]
# 主机名称
[ hello: <string> | default = global.smtp_hello ]
# SMTP 校验信息
[ auth_username: <string> | default = global.smtp_auth_username ]
[ auth_password: <secret> | default = global.smtp_auth_password ]
[ auth_secret: <secret> | default = global.smtp_auth_secret ]
[ auth_identity: <string> | default = global.smtp_auth_identity ]
# 是否开启 SMTP TLS
[ require_tls: <bool> | default = global.smtp_require_tls ]
# TLS 配置
tls_config:
[ <tls_config> ]
# 邮件 HTML body
[ html: <tmpl_string> | default = '{{ template "email.default.html" . }}' ]
# 邮件 text body
[ text: <tmpl_string> ]
# 邮件头部键值对
[ headers: { <string>: <tmpl_string>, ... } ]
5.4.2 webhook_config
1 | # 警报状态恢复是否要发送恢复邮件 |
5.5. inhibit_rules
inhibit_rules 模块中设置警报抑制功能,可以指定在特定条件下需要忽略的警报条件。可以使用此选项设置首选,比如优先处理某些警报,如果同一组中的警报同时发生,则忽略其他警报。
合理使用 inhibit_rules ,可以减少频发发送没有意义的警报的产生。
alertmanager 有 3个特性:
- 分组(
Grouping) - 抑制(
Inhibition) - 静默(
Silences)
本节不详细讨论这三个特性,后面会单独开篇章来分析。
6. group_interval 和 repeat_interval
我们例子中其实很简单,除了 global 配置全局邮件发送之外,其他就是:
1 | route: |
所以其实就很简单, 一旦收到警报,处理步骤如下:
- 根据标签 alertname 的值进行分组,如果是首次的话,等待 30s 让相同组的警报过来, 30s 之内,如果有其他组内的警报进来的话, 就合并成一组,然后发送给接收器 default-receiver, 然后这个接收器发送邮件,用的是默认模板
- 然后接下来又过了一分钟,又来了一条相同的警报信息,这时候除了等待 30s 归类之外,就要读 group_interval 配置,如果与上一条同组的警报通知间隔不到 5 分钟,那么就要等到 5 分钟,才会发送下一条警报
- 然后发送之前,判断本次的警报是否有恢复(状态是否有改变),这时候就要读 repeat_interval 的配置,也就是说,要发送重复警报的话,还要再等 10 分钟才行
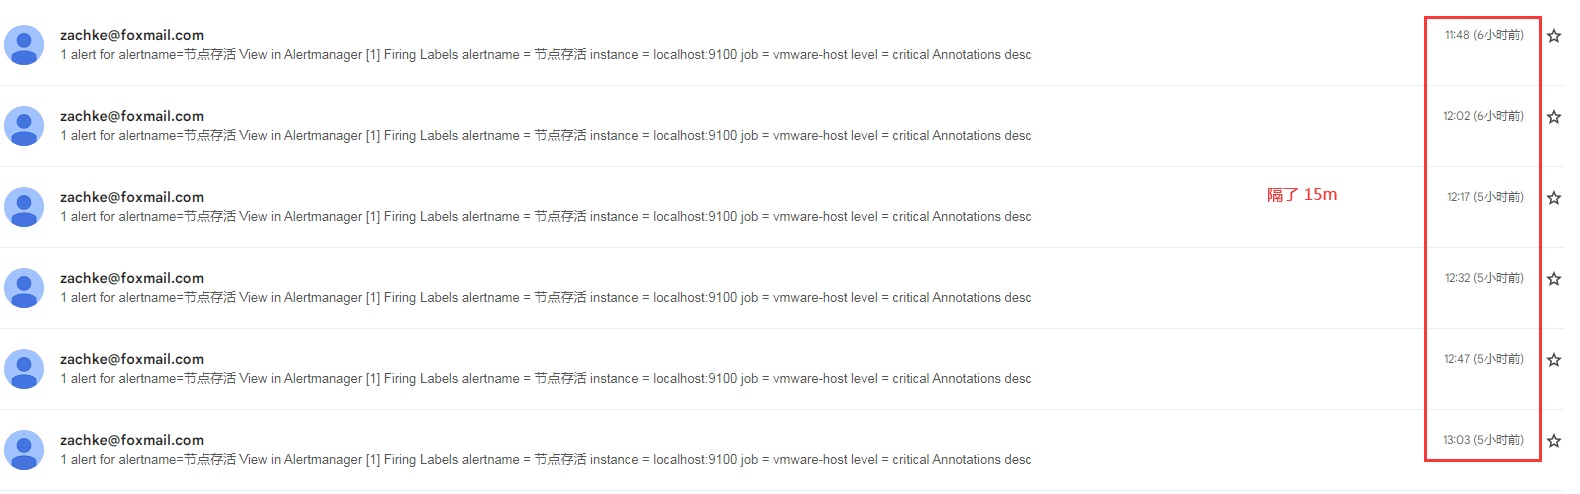
综上就可以看到,假设一条警报一直没有修复, 就会出现,除了第一次是马上发送警报,接下来要发重复警报的话,就要再过 group_interval + repeat_interval = 15 分钟
6.1 两台 node 相继挂掉的情况
接下来我们还是基于上述的配置,测试一下两台 node_exporter (localhost 和 234 这两台) 相继停掉的情况,时间线如下
- 15 分的时候, localhost 这一台的 node_exporter 关闭,警报变成 pending
- 16 分的时候, 过了 rule 的 for 等待时间(1 分钟),prometheus 将警报发送给 alertmanager
- alertmanager 收到警报,继续等待 30s (
group_wait), 发现没有同组的警报,并且上一次这个组的警报发送间隔超过了 5 分钟, 所以马上发送邮件 - 17 分的时候, 收到了邮件,因为警报内容跟之前测试的一样,所以在 gmail 那边,会归档到之前的那一封
- 18 分的时候,234 这一台的 node_exporter 关闭,然后警报变成 pending
- 19 分的时候,234 的警报也变成 firing
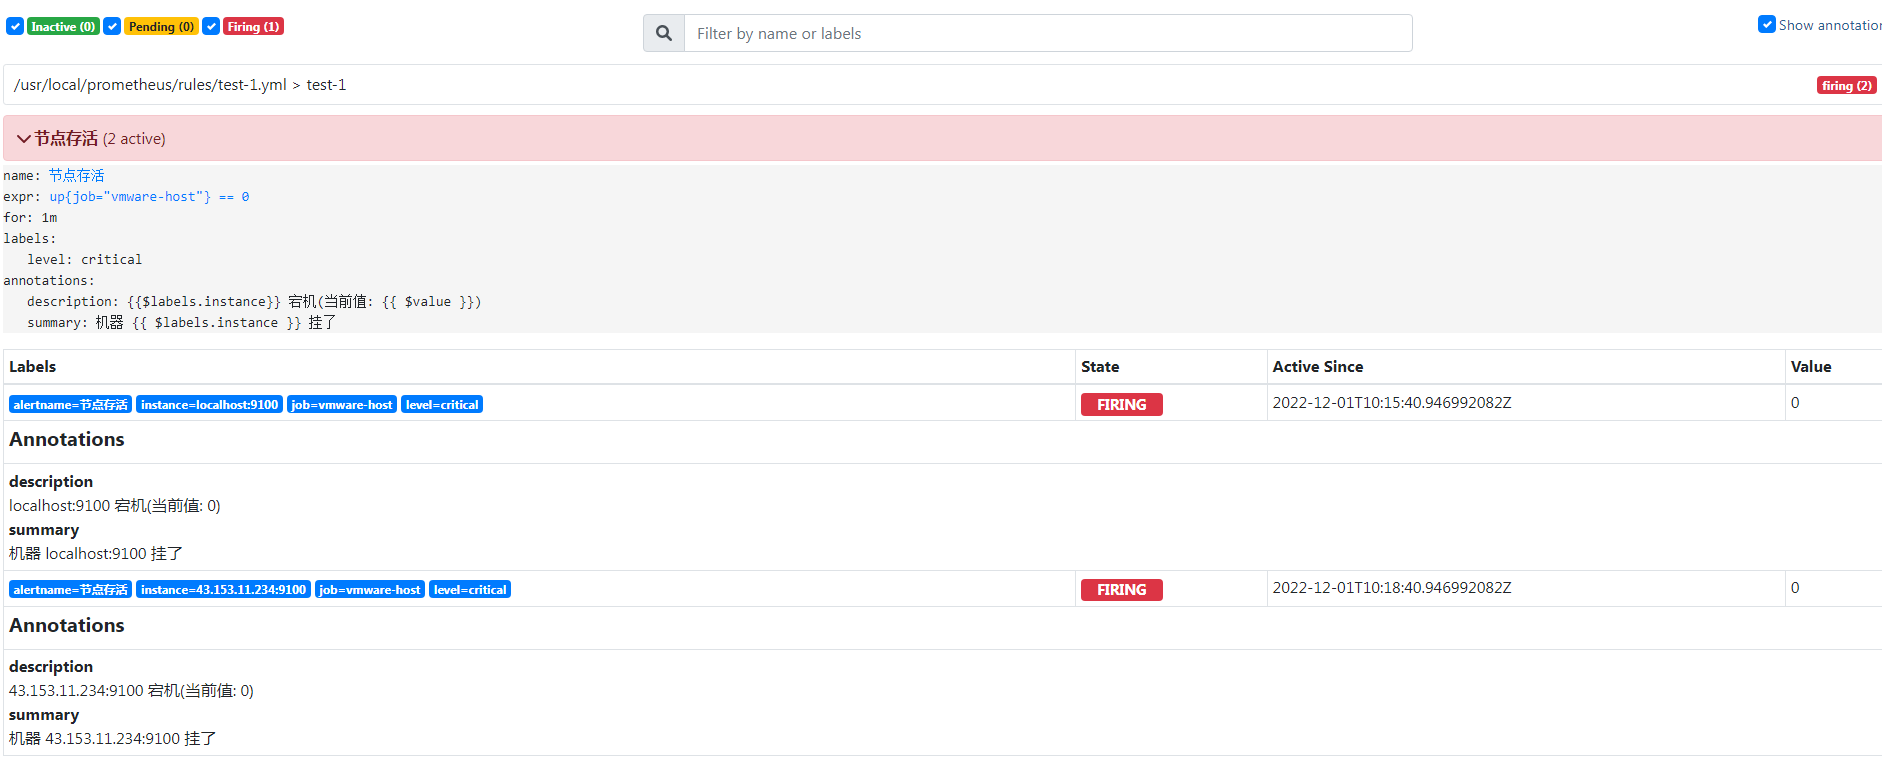
- alertmanager 收到警报,继续等待 30s (
group_wait), 如果有相同的警报,就合并成一条,然后判断间隔时间是否超过了 5 分钟,发现没有(上一次发是 17 分钟),继续等待,并且合并警报 - 22 分的时候,终于达到了 group 的间隔时间了,这时候触发 repeat_interval 判断,对比了,一下本次的报警信息跟上一次不一样 (本次两条报警),所以不满足再次等待条件, 发送邮件
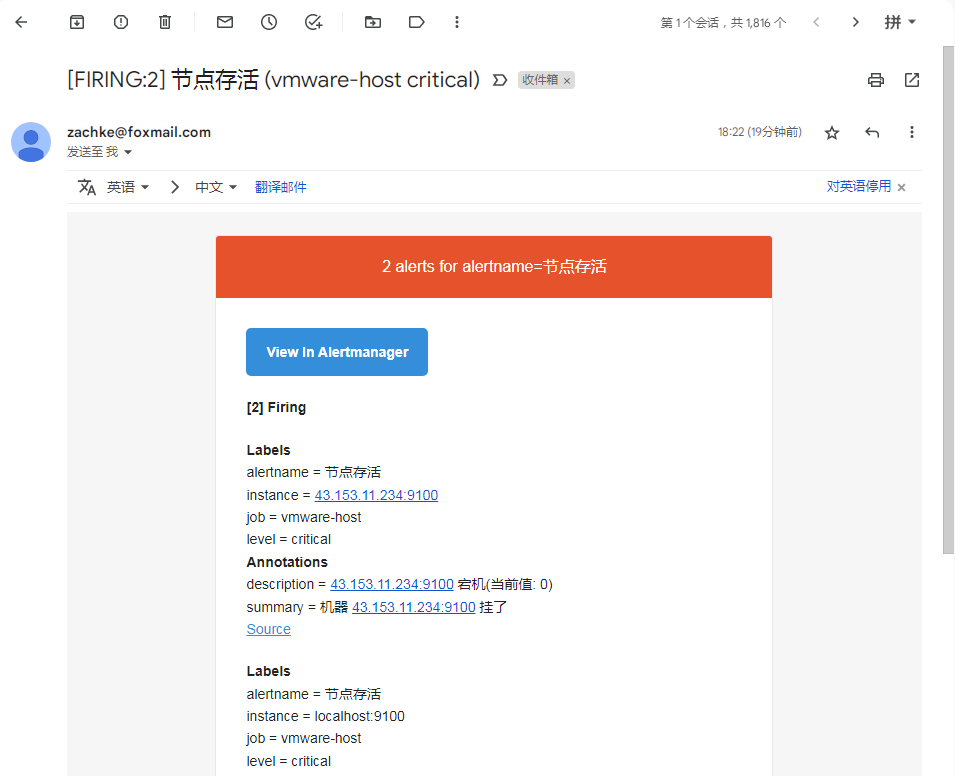
- 22 分的时候,收到邮件,内容不一样,单独一封

打开之后,发现内容就是两台的报警信息
7. 发送钉钉通知
正常工作中,现在大家都有用钉钉在协同办公,所以对于业务预警来说,发送钉钉通知预警是非常有用的事情。 所以接下来我们添加一下钉钉预警的
7.1 安装 Prometheus-webhook-Dingtalk
首先我们安装钉钉组件: 下载地址1
2
3
4
5
6
7
8
9
10
11
12
13
14
15
16
17
18
19
20
21
22
23
24
25
26
27
28
29
30
31
32
33
34
35
36
37
38
39
40
41
42
43
44
45
46
47
48
49
50
51
52
53
54
55
56
57
58
59
60
61
62
63
64
65
66# 下载解压
[root@VM-64-9-centos ~]# cd /usr/local/
[root@VM-64-9-centos local]# wget https://github.com/timonwong/prometheus-webhook-dingtalk/releases/download/v2.1.0/prometheus-webhook-dingtalk-2.1.0.linux-amd64.tar.gz
[root@VM-64-9-centos local]# tar xf prometheus-webhook-dingtalk-2.1.0.linux-amd64.tar.gz
[root@VM-64-9-centos local]# mv prometheus-webhook-dingtalk-2.1.0.linux-amd64 prometheus-webhook-dingtalk
# 创建 config.yml 配置文件,之前只有一个 example 文件,直接拷贝一份命名 config.yml
[root@VM-64-9-centos local]# cd prometheus-webhook-dingtalk/
[root@VM-64-9-centos prometheus-webhook-dingtalk]# cp config.example.yml config.yml
# 配置 config.yml
[root@VM-64-9-centos local]# cat prometheus-webhook-dingtalk/config.yml
## 这个参数要设置为 true, 才会去读自定义的模板,不然就会读程序的默认模板
no_builtin_template: true
## 模板文件路径, 这边一定要用绝对路径
templates:
- /usr/local/prometheus/templates/dingding-default.tmpl
## 设定监听的端点,可以设置多个
targets:
webhook_1:
url: https://oapi.dingtalk.com/robot/send?access_token=3aff7c1ac0122xxxxxxxxxxxxxxxxxxxxxxx85ac45f2cc942296
# 添加到 system 服务,这边的启动参数不要加双引号包裹,不然会启动失败
[root@VM-64-9-centos local]# cat /usr/lib/systemd/system/prometheus-webhook-dingtalk.service
[Unit]
Description=prometheus webhook dingtalk
Documentation=https://github.com/timonwong/prometheus-webhook-dingtalk
After=network.target
[Service]
Type=simple
ExecStart=/usr/local/prometheus-webhook-dingtalk/prometheus-webhook-dingtalk --web.listen-address=:8070 --web.enable-ui --config.file=/usr/local/prometheus-webhook-dingtalk/config.yml
ExecStop=/bin/kill -s QUIT $MAINPID
Restart=on-failure
[Install]
WantedBy=multi-user.target
# 启动服务
[root@VM-64-9-centos local]# systemctl daemon-reload
[root@VM-64-9-centos local]# systemctl enable prometheus-webhook-dingtalk
Created symlink from /etc/systemd/system/multi-user.target.wants/prometheus-webhook-dingtalk.service to /usr/lib/systemd/system/prometheus-webhook-dingtalk.service.
[root@VM-64-9-centos local]# systemctl start prometheus-webhook-dingtalk
# 查看服务启动状态,可以看到有在监听 8070 端口了
[root@VM-64-9-centos local]# systemctl status prometheus-webhook-dingtalk -l
● prometheus-webhook-dingtalk.service - prometheus webhook dingtalk
Loaded: loaded (/usr/lib/systemd/system/prometheus-webhook-dingtalk.service; disabled; vendor preset: disabled)
Active: active (running) since Fri 2022-12-02 11:25:59 CST; 1min 55s ago
Docs: https://github.com/timonwong/prometheus-webhook-dingtalk
Main PID: 4942 (prometheus-webh)
CGroup: /system.slice/prometheus-webhook-dingtalk.service
└─4942 /usr/local/prometheus-webhook-dingtalk/prometheus-webhook-dingtalk --web.listen-address=:8070 --web.enable-ui --config.file=/usr/local/prometheus-webhook-dingtalk/config.yml
Dec 02 11:25:59 VM-64-9-centos systemd[1]: Started prometheus webhook dingtalk.
Dec 02 11:25:59 VM-64-9-centos prometheus-webhook-dingtalk[4942]: ts=2022-12-02T03:25:59.452Z caller=main.go:59 level=info msg="Starting prometheus-webhook-dingtalk" version="(version=2.1.0, branch=HEAD, revision=8580d1395f59490682fb2798136266bdb3005ab4)"
Dec 02 11:25:59 VM-64-9-centos prometheus-webhook-dingtalk[4942]: ts=2022-12-02T03:25:59.452Z caller=main.go:60 level=info msg="Build context" (gogo1.18.1,userroot@177bd003ba4d,date20220421-08:19:05)=(MISSING)
Dec 02 11:25:59 VM-64-9-centos prometheus-webhook-dingtalk[4942]: ts=2022-12-02T03:25:59.452Z caller=coordinator.go:83 level=info component=configuration file=/usr/local/prometheus-webhook-dingtalk/config.yml msg="Loading configuration file"
Dec 02 11:25:59 VM-64-9-centos prometheus-webhook-dingtalk[4942]: ts=2022-12-02T03:25:59.452Z caller=coordinator.go:91 level=info component=configuration file=/usr/local/prometheus-webhook-dingtalk/config.yml msg="Completed loading of configuration file"
Dec 02 11:25:59 VM-64-9-centos prometheus-webhook-dingtalk[4942]: ts=2022-12-02T03:25:59.452Z caller=main.go:97 level=info component=configuration msg="Loading templates" templates=contrib/templates/default.tmpl
Dec 02 11:25:59 VM-64-9-centos prometheus-webhook-dingtalk[4942]: ts=2022-12-02T03:25:59.453Z caller=main.go:113 component=configuration msg="Webhook urls for prometheus alertmanager" urls=http://localhost:8070/dingtalk/webhook_1/send
Dec 02 11:25:59 VM-64-9-centos prometheus-webhook-dingtalk[4942]: ts=2022-12-02T03:25:59.453Z caller=web.go:208 level=info component=web msg="Start listening for connections" address=:8070
从上面的配置文件可以看到,我们只设置了一个 webhook 的端口,也就是这个:1
http://localhost:8070/dingtalk/webhook_1/send
后面在填 alertmanager 的 webhook 的 url 的时候,就是填这个, webhook_1 就是上面所配置的 target, 可以配置多个, 然后程序就会生成多个监听 url, 然后在 alertmanager 那边灵活分配到发送 webhook 到哪一个端点
上面有两个细节要注意:
- 一个是这个配置要设置为 true,程序才会去读取自定义的模板
1
no_builtin_template: true
刚开始这个没有设置,默认为 false,不管怎么设置,发现 钉钉通知都是发送默认的模板,因为项目文档太少,到后面我直接看源代码去了,结果才发现要读自定义模板,跟这个配置有关,以下是源代码:1
2
3
4
5
6
7
8
9
10
11
12
13
14
15
16
17
18
19
20
21
22
23
24
25
26
27
28
29
30
31
32
33
34
35
36
37
38
39func FromGlobs(loadBuiltinTemplate bool, paths ...string) (*Template, error) {
tmpl := template.New("").
Option("missingkey=zero").
Funcs(defaultFuncs).
Funcs(sprig.TxtFuncMap())
if loadBuiltinTemplate {
f, err := Assets.Open("/templates/default.tmpl")
if err != nil {
return nil, err
}
defer f.Close()
b, err := io.ReadAll(f)
if err != nil {
return nil, err
}
if _, err := tmpl.Parse(string(b)); err != nil {
return nil, err
}
}
for _, tp := range paths {
// ParseGlob in the template packages errors if not at least one file is
// matched. We want to allow empty matches that may be populated later on.
p, err := filepath.Glob(tp)
if err != nil {
return nil, err
}
if len(p) > 0 {
if _, err := tmpl.ParseGlob(tp); err != nil {
return nil, err
}
}
}
return &Template{tmpl: tmpl}, nil
}
然后他的调用方式是反着来的:1
tmpl, err := template.FromGlobs(!conf.NoBuiltinTemplate, conf.Templates...)
也就是要 NoBuiltinTemplate 为 true,里面才会变成 false, 才会读自定义模板路径
- 还有就是模板路径要绝对路径
这个也是很坑, 因为实例里面是相对路径的contrib/templates/legacy/template.tmpl, 导致我配置自定义的时候,刚开始也是放在这个 contrib 目录下的,结果一直报这个错误1
2
3
4
5
6[root@VM-64-9-centos templates]# journalctl -f -u prometheus-webhook-dingtalk.service
-- Logs begin at Mon 2022-11-14 09:42:41 CST. --
Dec 02 16:06:04 VM-64-9-centos systemd[1]: Unit prometheus-webhook-dingtalk.service entered failed state.
Dec 02 16:06:04 VM-64-9-centos systemd[1]: prometheus-webhook-dingtalk.service failed.
...
Dec 02 16:07:28 VM-64-9-centos prometheus-webhook-dingtalk[12891]: ts=2022-12-02T08:07:28.953Z caller=dingtalk.go:90 level=error component=web target=webhook_1 msg="Failed to build notification" err="template: :1:12: executing \"\" at <{{template \"ding.link.title\" .}}>: template \"ding.link.title\" not defined"
一直报这个 ding.link.title 参数没有定义, 但是明明模板有定义,为啥找不到,后面改成绝对路径,就可以找到了
可以使用 journalctl -f -u service 来跟进某一个 system server 的日志
7.2 模板配置
从上面的配置文件来看,除了配置端点之外,我们还自己创建了一个模板文件:1
/usr/local/prometheus/templates/dingding-default.tmpl
内容如下:1
2
3
4
5
6
7
8
9
10
11
12
13
14
15
16
17
18
19
20
21
22
23
24
25
26
27
28
29
30
31
32
33
34
35
36
37
38
39
40
41
42
43
44
45
46
47
48
49
50
51
52
53
54
55
56
57
58
59
60
61
62[root@VM-64-9-centos prometheus-webhook-dingtalk]# cat /usr/local/prometheus/templates/dingding-default.tmpl
{{/* 定义子标题 */}}
{{ define "__subject" }}[{{ .Status | toUpper }}{{ if eq .Status "firing" }}:{{ .Alerts.Firing | len }}{{ end }}] {{ .GroupLabels.SortedPairs.Values | join " " }} {{ if gt (len .CommonLabels) (len .GroupLabels) }}({{ with .CommonLabels.Remove .GroupLabels.Names }}{{ .Values | join " " }}{{ end }}){{ end }}{{ end }}
{{ define "__alertmanagerURL" }}{{ .ExternalURL }}/#/alerts?receiver={{ .Receiver }}{{ end }}
{{/* 定义警报内容*/}}
{{ define "default.__text_alert_list" }}{{ range . }}
**Trigger Time:** {{ dateInZone "2006.01.02 15:04:05" (.StartsAt) "Asia/Shanghai" }}
**Summary:** {{ .Annotations.summary }}
**Description:** {{ .Annotations.description }}
**Details:**
{{ range .Labels.SortedPairs }}{{ if and (ne (.Name) "severity") (ne (.Name) "summary") }}> - {{ .Name }}: {{ .Value | markdown | html }}
{{ end }}{{ end }}
{{ end }}{{ end }}
{{/* 定义警报恢复内容 */}}
{{ define "default.__text_resolved_list" }}{{ range . }}
**Trigger Time:** {{ dateInZone "2006.01.02 15:04:05" (.StartsAt) "Asia/Shanghai" }}
**Resolved Time:** {{ dateInZone "2006.01.02 15:04:05" (.EndsAt) "Asia/Shanghai" }}
**Summary:** {{ .Annotations.summary }}
**Details:**
{{ range .Labels.SortedPairs }}{{ if and (ne (.Name) "severity") (ne (.Name) "summary") }}> - {{ .Name }}: {{ .Value | markdown | html }}
{{ end }}{{ end }}
{{ end }}{{ end }}
{{/* 定义标题和内容 */}}
{{ define "default.title" }}{{ template "__subject" . }}{{ end }}
{{ define "default.content" }}#### \[{{ .Status | toUpper }}{{ if eq .Status "firing" }}:{{ .Alerts.Firing | len }}{{ end }}\] **[{{ index .GroupLabels "alertname" }}]({{ template "__alertmanagerURL" . }})**
{{/* 判断是警报还是恢复 */}}
{{/* 如果是警报 */}}
{{ if gt (len .Alerts.Firing) 0 -}}
**Alerts Firing**
{{ template "default.__text_alert_list" .Alerts.Firing }}
{{ range .AtMobiles }}@{{ . }}{{ end }}
{{- end }}
{{/* 如果是恢复警报 */}}
{{ if gt (len .Alerts.Resolved) 0 -}}
**Alerts Resolved**
{{ template "default.__text_resolved_list" .Alerts.Resolved }}
{{ range .AtMobiles }}@{{ . }}{{ end }}
{{- end }}
{{- end }}
{{/* 下面这两个钉钉的字段定义是一定要有的,因为程序会执行 */}}
{{ define "ding.link.title" }}{{ template "default.title" . }}{{ end }}
{{ define "ding.link.content" }}{{ template "default.content" . }}{{ end }}
这个模板语法用的 golang 的语法模板:
而且对于这个钉钉模板来说, 他发送钉钉通知的代码是这样子的:1
2
3
4DefaultTargetMessage = TargetMessage{
Title: `{{ template "ding.link.title" . }}`,
Text: `{{ template "ding.link.content" . }}`,
}
也就是我们必须要在模板文件里面至少要定义这两个值,哪怕只是以下这种极简单的硬编码也是可以 work 的1
2{{ define "ding.link.title" }} hello title {{ end }}
{{ define "ding.link.content" }} hello content {{ end }}
至于参数匹配的规则大概是这样子
首先 alertmanager 那边的 webhook 请求的 post body 体是这样子的(相关文档地址):
1
2
3
4
5
6
7
8
9
10
11
12
13
14
15
16
17
18
19
20
21
22
23{
"version": "4",
"groupKey": <string>, // key identifying the group of alerts (e.g. to deduplicate)
"truncatedAlerts": <int>, // how many alerts have been truncated due to "max_alerts"
"status": "<resolved|firing>",
"receiver": <string>,
"groupLabels": <object>,
"commonLabels": <object>,
"commonAnnotations": <object>,
"externalURL": <string>, // backlink to the Alertmanager.
"alerts": [
{
"status": "<resolved|firing>",
"labels": <object>,
"annotations": <object>,
"startsAt": "<rfc3339>",
"endsAt": "<rfc3339>",
"generatorURL": <string>, // identifies the entity that caused the alert
"fingerprint": <string> // fingerprint to identify the alert
},
...
]
}然后将这边 body 体转换对 struct 对象:
1
2
3
4
5
6
7
8
9
10
11
12
13
14
15
16
17
18
19
20
21
22
23
24
25
26type Data struct {
Receiver string `json:"receiver"`
Status string `json:"status"`
Alerts Alerts `json:"alerts"`
GroupLabels KV `json:"groupLabels"`
CommonLabels KV `json:"commonLabels"`
CommonAnnotations KV `json:"commonAnnotations"`
ExternalURL string `json:"externalURL"`
AtMobiles []string
}
// Alert holds one alert for notification templates.
type Alert struct {
Status string `json:"status"`
Labels KV `json:"labels"`
Annotations KV `json:"annotations"`
StartsAt time.Time `json:"startsAt"`
EndsAt time.Time `json:"endsAt"`
GeneratorURL string `json:"generatorURL"`
Fingerprint string `json:"fingerprint"`
}
// Alerts is a list of Alert objects.
type Alerts []Alert然后接下来就是模板插值了
7.3 配置到 alertmanager
同时可以配置: alertmanager ,将其加进去, 多了一个恢复状态的回执 send_resolved1
2
3
4
5
6
7
8
9
10
11
12
13
14
15
16
17
18
19
20
21
22
23
24
25
26
27
28
29
30
31
32
33[root@VM-64-9-centos ~]# cat /usr/local/alertmanager/alertmanager.yml
global:
smtp_smarthost: 'smtp.qq.com:25'
smtp_from: 'z***e@foxmail.com'
smtp_auth_username: 'z***e@foxmail.com'
smtp_auth_password: 'ypgtxxxxxxxxxxxx'
smtp_require_tls: false
route:
  group_by: ['alertname']
  group_wait: 30s
  group_interval: 5m
  repeat_interval: 10m
  receiver: default-receiver
receivers:
  - name: 'default-receiver'
    email_configs:
    - to: 'k****o@gmail.com'
webhook_configs:
- url: http://localhost:8070/dingtalk/webhook_1/send
send_resolved: true
# 检查格式是否正确
[root@VM-64-9-centos alertmanager]# ./amtool check-config alertmanager.yml
Checking 'alertmanager.yml' SUCCESS
Found:
- global config
- route
- 0 inhibit rules
- 1 receivers
- 0 templates
# 最后重启
[root@VM-64-9-centos ~]# systemctl restart alertmanager
7.4 接下来测试
先把 node_exporter 关掉一台,然后过段时间再开启,这时候就可以收到报警和恢复的钉钉通知了
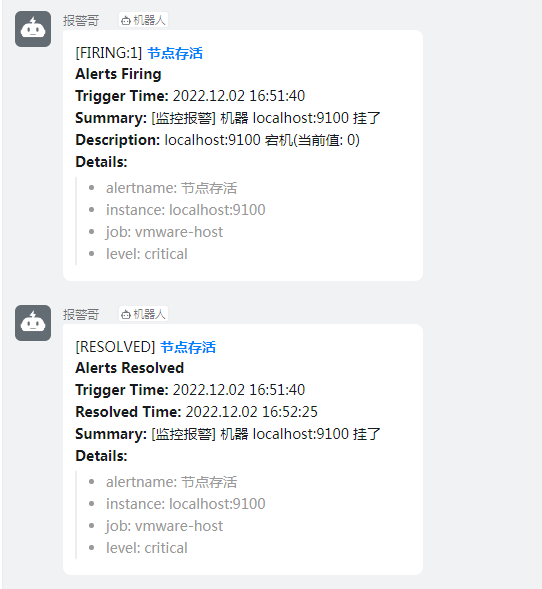
8. 邮件配置自定义模板
通过上面我们可以看到 钉钉通知可以发送自定义模板,也可以设置恢复警报, 那么对于邮件通知来说,也是可以的
Prometheus 支持在警报的注释和标签以及服务的控制台页面中进行模板化。模板能够对本地数据库运行查询、迭代数据、使用条件、格式化数据等。Prometheus 模板语言基于Go 模板系统。
发送给接收者的通知是通过模板构建的。 alertmanager 带有默认模板,但也可以自定义。其中默认模板就是这个:
- alertmanager default.tmpl
- 还有一个就是邮件的 html 模板: alertmanager template email.html
很多语法都跟我们刚才创建钉钉通知的模板的语法一样,因为都是从相同的地方取值的,所以我们简单改造一下,新建一个:1
2
3
4
5
6
7
8
9
10
11
12
13
14
15
16
17
18
19
20
21
22
23
24
25
26
27
28
29
30
31
32
33
34
35
36
37
38
39
40
41
42
43
44
45
46
47
48
49
50
51
52
53
54
55
56
57
58
59
60
61
62
63
64
65
66
67
68
69
70
71
72
73
74
75
76
77
78
79
80
81
82
83
84
85
86
87
88
89
90
91
92
93
94
95
96
97
98
99
100
101
102
103
104
105
106
107
108
109
110
111
112
113
114
115
116
117
118
119
120
121
122
123
124
125
126
127
128
129
130
131
132
133
134
135
136
137
138
139
140
141
142
143
144
145
146
147
148
149
150
151
152
153
154
155
156
157
158
159
160
161
162
163
164
165
166
167
168
169
170
171
172
173
174
175
176
177
178
179
180
181
182
183
184
185
186
187
188
189
190
191
192
193
194
195
196
197
198
199
200
201
202
203
204
205
206
207
208
209
210
211
212
213
214
215
216
217
218
219
220
221
222
223
224
225
226
227
228
229
230
231
232
233
234
235
236
237
238
239
240
241
242
243
244
245
246
247
248
249
250
251
252
253
254
255
256
257
258
259
260
261
262
263
264
265
266
267
268
269
270
271
272
273
274
275
276
277
278
279
280
281
282
283
284
285
286
287
288
289
290
291
292
293
294
295
296
297
298
299
300
301
302
303
304
305
306
307
308
309
310
311
312
313
314
315
316
317
318
319
320
321
322
323
324
325
326
327
328
329
330
331
332
333
334
335
336
337
338
339
340
341
342
343
344
345
346
347
348
349
350
351
352
353
354
355
356
357
358
359
360
361
362
363
364
365
366
367
368
369
370
371
372
373
374
375
376
377
378
379
380
381
382
383
384
385
386
387
388
389[root@VM-64-9-centos alertmanager]# cat /usr/local/prometheus/templates/mail.tmpl
{{ define "custom_mail_subject" }} {{ template "__subject" . }} {{ end }}
{{ define "custom_mail_html" }}
<html xmlns="http://www.w3.org/1999/xhtml">
<head>
<meta name="viewport" content="width=device-width" />
<meta http-equiv="Content-Type" content="text/html; charset=UTF-8" />
<title>{{ template "__subject" . }}</title>
<style>
/* -------------------------------------
GLOBAL
A very basic CSS reset
------------------------------------- */
* {
margin: 0;
font-family: "Helvetica Neue", Helvetica, Arial, sans-serif;
box-sizing: border-box;
font-size: 14px;
}
img {
max-width: 100%;
}
body {
-webkit-font-smoothing: antialiased;
-webkit-text-size-adjust: none;
width: 100% !important;
height: 100%;
line-height: 1.6em;
/* 1.6em * 14px = 22.4px, use px to get airier line-height also in Thunderbird, and Yahoo!, Outlook.com, AOL webmail clients */
/*line-height: 22px;*/
}
/* Let's make sure all tables have defaults */
table td {
vertical-align: top;
}
/* -------------------------------------
BODY & CONTAINER
------------------------------------- */
body {
background-color: #f6f6f6;
}
.body-wrap {
background-color: #f6f6f6;
width: 100%;
}
.container {
display: block !important;
max-width: 600px !important;
margin: 0 auto !important;
/* makes it centered */
clear: both !important;
}
.content {
max-width: 600px;
margin: 0 auto;
display: block;
padding: 20px;
}
/* -------------------------------------
HEADER, FOOTER, MAIN
------------------------------------- */
.main {
background-color: #fff;
border: 1px solid #e9e9e9;
border-radius: 3px;
}
.content-wrap {
padding: 30px;
}
.content-block {
padding: 0 0 20px;
}
.header {
width: 100%;
margin-bottom: 20px;
}
.footer {
width: 100%;
clear: both;
color: #999;
padding: 20px;
}
.footer p, .footer a, .footer td {
color: #999;
font-size: 12px;
}
/* -------------------------------------
TYPOGRAPHY
------------------------------------- */
h1, h2, h3 {
font-family: "Helvetica Neue", Helvetica, Arial, "Lucida Grande", sans-serif;
color: #000;
margin: 40px 0 0;
line-height: 1.2em;
font-weight: 400;
}
h1 {
font-size: 32px;
font-weight: 500;
/* 1.2em * 32px = 38.4px, use px to get airier line-height also in Thunderbird, and Yahoo!, Outlook.com, AOL webmail clients */
/*line-height: 38px;*/
}
h2 {
font-size: 24px;
/* 1.2em * 24px = 28.8px, use px to get airier line-height also in Thunderbird, and Yahoo!, Outlook.com, AOL webmail clients */
/*line-height: 29px;*/
}
h3 {
font-size: 18px;
/* 1.2em * 18px = 21.6px, use px to get airier line-height also in Thunderbird, and Yahoo!, Outlook.com, AOL webmail clients */
/*line-height: 22px;*/
}
h4 {
font-size: 14px;
font-weight: 600;
}
p, ul, ol {
margin-bottom: 10px;
font-weight: normal;
}
p li, ul li, ol li {
margin-left: 5px;
list-style-position: inside;
}
/* -------------------------------------
LINKS & BUTTONS
------------------------------------- */
a {
color: #348eda;
text-decoration: underline;
}
.btn-primary {
text-decoration: none;
color: #FFF;
background-color: #348eda;
border: solid #348eda;
border-width: 10px 20px;
line-height: 2em;
/* 2em * 14px = 28px, use px to get airier line-height also in Thunderbird, and Yahoo!, Outlook.com, AOL webmail clients */
/*line-height: 28px;*/
font-weight: bold;
text-align: center;
cursor: pointer;
display: inline-block;
border-radius: 5px;
text-transform: capitalize;
}
/* -------------------------------------
OTHER STYLES THAT MIGHT BE USEFUL
------------------------------------- */
.last {
margin-bottom: 0;
}
.first {
margin-top: 0;
}
.aligncenter {
text-align: center;
}
.alignright {
text-align: right;
}
.alignleft {
text-align: left;
}
.clear {
clear: both;
}
/* -------------------------------------
ALERTS
Change the class depending on warning email, good email or bad email
------------------------------------- */
.alert {
font-size: 16px;
color: #fff;
font-weight: 500;
padding: 20px;
text-align: center;
border-radius: 3px 3px 0 0;
}
.alert a {
color: #fff;
text-decoration: none;
font-weight: 500;
font-size: 16px;
}
.alert.alert-warning {
background-color: #E6522C;
}
.alert.alert-bad {
background-color: #D0021B;
}
.alert.alert-good {
background-color: #68B90F;
}
/* -------------------------------------
INVOICE
Styles for the billing table
------------------------------------- */
.invoice {
margin: 40px auto;
text-align: left;
width: 80%;
}
.invoice td {
padding: 5px 0;
}
.invoice .invoice-items {
width: 100%;
}
.invoice .invoice-items td {
border-top: #eee 1px solid;
}
.invoice .invoice-items .total td {
border-top: 2px solid #333;
border-bottom: 2px solid #333;
font-weight: 700;
}
/* -------------------------------------
RESPONSIVE AND MOBILE FRIENDLY STYLES
------------------------------------- */
@media only screen and (max-width: 640px) {
body {
padding: 0 !important;
}
h1, h2, h3, h4 {
font-weight: 800 !important;
margin: 20px 0 5px !important;
}
h1 {
font-size: 22px !important;
}
h2 {
font-size: 18px !important;
}
h3 {
font-size: 16px !important;
}
.container {
padding: 0 !important;
width: 100% !important;
}
.content {
padding: 0 !important;
}
.content-wrap {
padding: 10px !important;
}
.invoice {
width: 100% !important;
}
}
</style>
</head>
<body itemscope itemtype="http://schema.org/EmailMessage">
<table class="body-wrap">
<tr>
<td></td>
<td class="container" width="600">
<div class="content">
<table class="main" width="100%" cellpadding="0" cellspacing="0">
<tr>
{{ if gt (len .Alerts.Firing) 0 }}
<td class="alert alert-warning">
{{ else }}
<td class="alert alert-good">
{{ end }}
{{ .Alerts | len }} alert{{ if gt (len .Alerts) 1 }}s{{ end }} for {{ range .GroupLabels.SortedPairs }}
{{ .Name }}={{ .Value }}
{{ end }}
</td>
</tr>
<tr>
<td class="content-wrap">
<table width="100%" cellpadding="0" cellspacing="0">
<tr>
<td class="content-block">
<a href='{{ template "__alertmanagerURL" . }}' class="btn-primary">View in {{ template "__alertmanager" . }}</a>
</td>
</tr>
{{ if gt (len .Alerts.Firing) 0 }}
<tr>
<td class="content-block">
<strong>[{{ .Alerts.Firing | len }}] Firing</strong>
</td>
</tr>
{{ end }}
{{ range .Alerts.Firing }}
<tr>
<td class="content-block">
<strong>标签组:</strong><br />
{{ range .Labels.SortedPairs }}{{ .Name }} = {{ .Value }}<br />{{ end }}
{{ if gt (len .Annotations) 0 }}<strong>描述:</strong><br />{{ end }}
{{ range .Annotations.SortedPairs }}{{ .Name }} = {{ .Value }}<br />{{ end }}
<strong>触发时间(UTC):</strong>** {{ .StartsAt }} <br />
<a href="{{ .GeneratorURL }}">查看详情</a><br />
</td>
</tr>
{{ end }}
{{ if gt (len .Alerts.Resolved) 0 }}
{{ if gt (len .Alerts.Firing) 0 }}
<tr>
<td class="content-block">
<br />
<hr />
<br />
</td>
</tr>
{{ end }}
<tr>
<td class="content-block">
<strong>[{{ .Alerts.Resolved | len }}] Resolved</strong>
</td>
</tr>
{{ end }}
{{ range .Alerts.Resolved }}
<tr>
<td class="content-block">
<strong>标签:</strong><br />
{{ range .Labels.SortedPairs }}{{ .Name }} = {{ .Value }}<br />{{ end }}
{{ if gt (len .Annotations) 0 }}<strong>详情:</strong><br />{{ end }}
{{ range .Annotations.SortedPairs }}{{ .Name }} = {{ .Value }}<br />{{ end }}
<strong>触发时间(UTC):</strong>** {{ .StartsAt }} <br />
<strong>恢复时间(UTC):</strong>** {{ .EndsAt }} <br />
<a href="{{ .GeneratorURL }}">点击详情</a><br />
</td>
</tr>
{{ end }}
</table>
</td>
</tr>
</table>
<div class="footer">
<table width="100%">
<tr>
<td class="aligncenter content-block"><a href='{{ .ExternalURL }}'>Sent by {{ template "__alertmanager" . }}</a></td>
</tr>
</table>
</div></div>
</td>
<td></td>
</tr>
</table>
</body>
</html>
{{ end }}
看似很长,其实是直接将原先的 html 模板拿来进行改造的,添加了两个自定义模板对象
custom_mail_subject-> 对应标题custom_mail_html-> 对应 html 内容体
这两个模板对象都会在下面的配置文件中指定
而这个模板一旦被定义好,是可以一直被使用的,不仅仅是用于 mail 的模板,其他的通知手段如果想用的话,一样可以用。
接下来配置 alertmanager.yml, 增加了 templates 的配置和 email_configs 这两个小节,主要是用来定制 mail 的 subject 和 html content, 所对应的模板就是上述创建的模板文件所定义的1
2
3
4
5
6
7
8
9
10
11
12
13
14
15
16
17
18
19
20
21
22
23
24
25
26
27
28
29
30
31
32
33
34
35
36
37
38
39
40[root@VM-64-9-centos alertmanager]# cat alertmanager.yml
global:
smtp_smarthost: 'smtp.qq.com:25'
smtp_from: 'z***e@foxmail.com'
smtp_auth_username: 'z***e@foxmail.com'
smtp_auth_password: 'ypgtxxxxxxxxxxxx'
smtp_require_tls: false
templates:
- '/usr/local/prometheus/templates/mail.tmpl'
route:
group_by: ['alertname']
group_wait: 30s
group_interval: 5m
repeat_interval: 10m
receiver: default-receiver
receivers:
- name: 'default-receiver'
email_configs:
- to: 'k****o@gmail.com'
send_resolved: true
headers:
subject: '{{ template "custom_mail_subject" . }}'
html: '{{ template "custom_mail_html" . }}'
webhook_configs:
- url: http://localhost:8070/dingtalk/webhook_1/send
send_resolved: true
# 验证
[root@VM-64-9-centos alertmanager]# ./amtool check-config alertmanager.yml
Checking 'alertmanager.yml' SUCCESS
Found:
- global config
- route
- 0 inhibit rules
- 1 receivers
- 1 templates
SUCCESS
# 重启配置生效
[root@VM-64-9-centos alertmanager]# systemctl restart alertmanager.service
后面就可以看到发送的结果,一个是警报,一个是警报恢复的 (可以看到跟原先相比,之前的英文改成中文了,并且添加了时间)
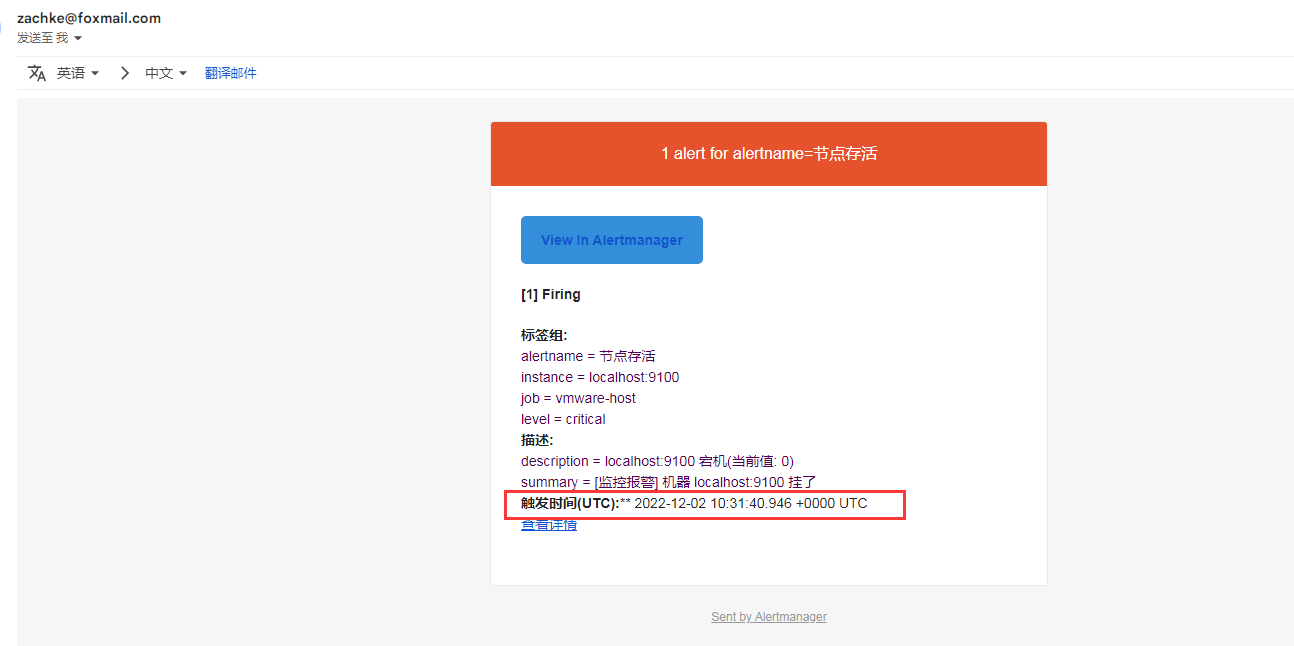
下面这个是恢复的
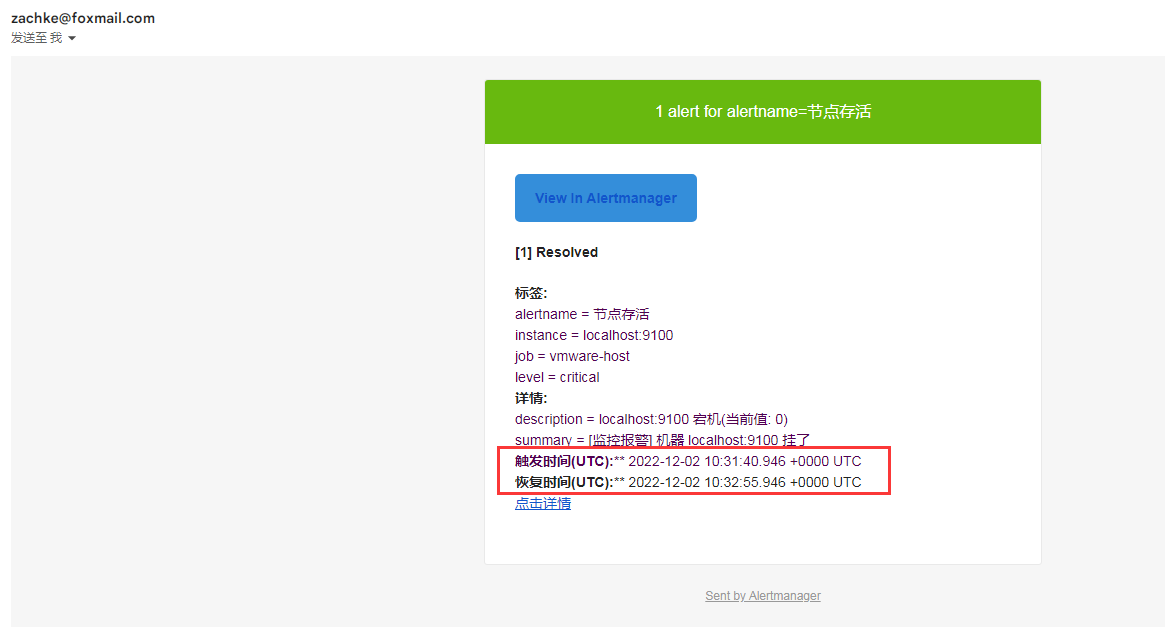
这样子我们就可以自己定制我们的邮件通知的模板了
9. alertmanager 也可以热更新配置文件
alertmanager 除了上述的用 system 来重启让配置生效之外,也可以用热更新来生效配置文件: 重新加载1
curl -X POST localhost:9093/-/reload
通知模板的数据结构
上述无论是 钉钉通知的模板还是邮件的模板,他所读取的数据都是 prometheus 发送给 alertmanager 的,这些数据结构包含的 键值对 的含义如下
alertmanager 的通知模板基于Go 模板系统。请注意,某些字段被评估为文本,而其他字段被评估为 HTML,这将影响转义。
| Name | Type | Notes |
|---|---|---|
| Receiver | string | 接受警报通知的接收器名称 |
| Status | string | 警报状态,例如:Firing或Resolved的通知 |
| Alerts | alert | 警报通知的真实内容,警报中的所有列表 |
| GroupLabels | KV | 包含警报通知的组标签 |
| CommonLabels | KV | 所有警报的公共标签,包含GroupLabels的所有标签 |
| CommonAnnotations | KV | 注释,比如自定义的一些字符串 |
| ExternalURL | string | 警报信息中的Alertmanager地址 |
其中 alert 包含:
| Name | Type | Notes |
|---|---|---|
| Status | string | 定义警报是已解决还是正在触发。 |
| Labels | KV | 要附加到警报的一组标签。 |
| Annotations | KV | 警报的一组注释。rule 规则定义的 |
| StartsAt | time.Time | 警报开始触发的时间 |
| EndsAt | time.Time | 警报恢复时间,仅当警报的结束时间已知时才设置 |
| GeneratorURL | string | 标识此警报的引起实体的反向链接 |
| Fingerprint | string | 可用于识别警报的指纹。 |
其他 webhook 集成接收器
除了上述 钉钉是 通过 webhook 接收器来处理的之外,alertmanager 的 webhook 接收器也集成了很多第三方的通知,比如 gitlab,jira,telegram,zoom 等等, 具体可以看到: Alertmanager Webhook Receiver
总结
通过本节,我们已经在 prometheus server 配置警报规则并触发,然后通过 alertmanager 进行警报通知发送, 而且可以做到使用钉钉发送和邮件发送了,并且模板都可以自定义。
下一节,我们再详细分析一下 alertmanager 的三个特性, 理解这 3 个特性,能够更好的帮助我们去设置警报:
- 分组(
Grouping) - 抑制(
Inhibition) - 静默(
Silences)
参考资料:
- alertmanager
- alertmanager configuration
- prometheus alertmanager config
- prometheus alerting rules
- 通知模板参考
- Awesome Prometheus alerts
- TEMPLATE EXAMPLES
- 通知模板参考
- How to change Prometheus Alertmanager E-Mail template
- Prometheus监控神器-Rules篇
- Prometheus监控神器-Alertmanager篇(1)
- Prometheus监控神器-Alertmanager篇(2)
- prometheus使用 (十四) 告警模板配置
- Prometheus学习系列(十七)之模板参考