前言
我们都知道 prometheus 是一个监控程序, 并且可以采集指标,但是之前我们的测试都是用的官方的 exporter ,比如 node_exporter 这种监控主机的。
其实 prometheus 采集的指标一样可以用于我们的自己写的程序, 关于 prometheus 的 客户端的 sdk lib 可以看: prometheus client libraries
里面很多主流语言都有包含,比如 Golang, Python, Java, Node.js, PHP 等,有一些是 prometheus 官方自己维护的,有一些是第三方贡献者写的。
当然如果你自己使用的语言不在上面,也可以按照 prometheus 标准实现一个该语言的 客户端 sdk 库: 编写客户端库的指南
所以本节我们就自己用一个程序来实现 prometheus 的 客户端功能,然后自定义一些抛送的指标。
指标和数据模型
在实现 prometheus 的 客户端功能,那么就要了解 prometheus 的指标和数据模型,这一块直接看 基于 prometheus 打造监控报警后台 (2) - 指标类型和数据模型, 文章已经讲的很详细了。
我们只需要在我们程序中通过实现这四种类型(Counter, Gauge, Histogram, Summary)之一的指标,那么就是符合 prometheus 客户端的抛送指标了。
demo
接下来我们就简单用 golang 写一个 demo, 然后实现几个自定义的指标, golang 的 客户端 sdk 库是这个: client_golang, 在原有指标不变的情况(这个库本来就会收集一些默认的指标,比如 goroutines 之类的)下,我们再增加三个指标:
- http 请求 api 的次数,每一个都有 method, code, handler 等标签, 类型是
Counter, 指标名称为myapp_http_requests_total - 当前内存使用比例,类型是
Gauge, 指标名称为myapp_memory_usage - 当前 cpu 使用比例,类似是
Gauge,指标名称为myapp_cpu_usage
关于怎么写 export 客户端,可以参照这一份文档: writing exporters
同时官方还提供了一些 指标和标签的 命名的最佳实践: metric and label naming
关于 client_golang 的使用, 官方也有一个简单的 demo: instrumenting a go application for prometheus
1. 最小化
一个最小化的 prometheus 的 golang 客户端如下:1
2
3
4
5
6
7
8
9
10
11
12package main
import (
"net/http"
"github.com/prometheus/client_golang/prometheus/promhttp"
)
func main() {
http.Handle("/metrics", promhttp.Handler())
http.ListenAndServe(":2112", nil)
}
然后我们试着运行起来:1
go run main.go
这时候用 curl 就可以看到了:
这样子一个最小化的包含 prometheus 客户端的程序就好了,里面只有一些默认采集的数据
2. 加入自定义采集指标
接下来我们就加入自定义采集指标,具体代码如下(为了方便展示代码,我是全部写在一个 main.go,所以结构会差一点):1
2
3
4
5
6
7
8
9
10
11
12
13
14
15
16
17
18
19
20
21
22
23
24
25
26
27
28
29
30
31
32
33
34
35
36
37
38
39
40
41
42
43
44
45
46
47
48
49
50
51
52
53
54
55
56
57
58
59
60
61
62
63
64
65
66
67
68
69
70
71
72
73
74
75
76
77
78
79
80
81
82
83
84
85
86
87
88
89
90
91
92
93
94
95
96
97
98
99
100
101
102
103
104
105
106
107
108
109
110
111
112
113
114
115
116
117
118
119
120
121
122
123
124
125
126
127
128
129
130
131
132
133
134
135
136
137
138
139
140
141
142
143
144
145
146
147
148
149
150
151
152
153
154
155
156
157
158
159
160
161
162
163
164
165
166
167
168
169
170
171
172
173
174
175
176
177
178
179
180
181
182
183
184
185
186
187
188
189
190
191
192
193
194
195
196
197
198
199
200
201
202
203
204
205package main
import (
"fmt"
"math"
"net/http"
"reflect"
"strconv"
"time"
"github.com/prometheus/client_golang/prometheus"
"github.com/prometheus/client_golang/prometheus/collectors"
"github.com/prometheus/client_golang/prometheus/promhttp"
"github.com/shirou/gopsutil/v3/cpu"
"github.com/shirou/gopsutil/v3/mem"
)
//=========================prometheus 相关==========================
// GetPromRegistry 用于获取 prometheus 的指标挂载口。
func getPromRegistry() *prometheus.Registry {
registry := prometheus.NewRegistry()
registry.MustRegister(collectors.NewGoCollector())
// 通过反射挂载 PromMetrics 中的所有指标。
promMetricsVal := reflect.ValueOf(PromMetrics)
for i := 0; i < promMetricsVal.NumField(); i++ {
registry.MustRegister(promMetricsVal.Field(i).Interface().(prometheus.Collector))
}
return registry
}
// PromMetrics 内定义了项目中使用到的 Prometheus 统计量。
var PromMetrics = struct {
MemoryUsage prometheus.Gauge // 内存使用比例
CpuUsage prometheus.Gauge // cpu 使用比例
HttpRequestsTotal *prometheus.CounterVec // http 请求总次数
}{
MemoryUsage: prometheus.NewGauge(prometheus.GaugeOpts{
Name: "myapp_memory_usage",
Help: "The memory usage",
}),
CpuUsage: prometheus.NewGauge(prometheus.GaugeOpts{
Name: "myapp_cpu_usage",
Help: "The cpu usage",
}),
HttpRequestsTotal: prometheus.NewCounterVec(prometheus.CounterOpts{
Name: "myapp_http_requests_total",
Help: "The total of HTTP requests.",
},
[]string{ // 指定标签组
"code", // http 的 返回值
"method", // 请求方法
"handle", // 请求 uri
},
),
}
//=========================重写 ResponseWriter 以便获取返回 status 值==========================
type loggingResponseWriter struct {
http.ResponseWriter
statusCode int
}
func NewLoggingResponseWriter(w http.ResponseWriter) *loggingResponseWriter {
return &loggingResponseWriter{w, http.StatusOK}
}
func (lrw *loggingResponseWriter) WriteHeader(code int) {
lrw.statusCode = code
lrw.ResponseWriter.WriteHeader(code)
}
//=========================获取内存, cpu 指数相关==========================
type MemUsage struct {
Total uint64
Free uint64
UsedPercent uint64
}
// GetMemUsage 用于获取服务器内存情况。
func getMemUsage() MemUsage {
if v, err := mem.VirtualMemory(); err != nil {
return MemUsage{}
} else {
return MemUsage{Total: v.Total, Free: v.Free, UsedPercent: uint64(v.UsedPercent)}
}
}
// GetCpuUsage 用于获取服务器 CPU 使用率。
func getCpuUsage() float64 {
if c, err := cpu.Percent(time.Duration(time.Second), false); err != nil { // 这里直接获取所有核心的。
return math.NaN()
} else {
// 没有错的话一定会有一个元素。
fc := c[0]
return fc
}
}
// 定期获取 cpu 和 内存的使用情况
func recordMemoryAndCpuMetrics() {
go func() {
for {
PromMetrics.MemoryUsage.Set(float64(getMemUsage().UsedPercent))
PromMetrics.CpuUsage.Set(getCpuUsage())
time.Sleep(5 * time.Second)
}
}()
}
func main() {
recordMemoryAndCpuMetrics()
// 普通接口
http.Handle("/list", wrapHandlerWithLogging(httpBaseHandle(listHandle)))
http.Handle("/getName", wrapHandlerWithLogging(httpBaseHandle(getNameHandle)))
http.Handle("/", wrapHandlerWithLogging(httpBaseHandle(homeHandle)))
// 收集指标接口
http.Handle("/myMetrics", metricsWithBasicAuth())
http.ListenAndServe(":2112", nil)
}
// 使用带帐号密码验证的 prometheus 接口,提高数据安全性。
func metricsWithBasicAuth() http.Handler {
const user = "prometheus"
const pwd = "abc123456"
registry := getPromRegistry()
inner := promhttp.HandlerFor(registry, promhttp.HandlerOpts{Registry: registry})
return http.HandlerFunc(func(res http.ResponseWriter, req *http.Request) {
u, p, ok := req.BasicAuth()
if !ok || u != user || p != pwd {
fmt.Println("unauthorized metrics " + u + ":" + p)
setHttpMetrics(req, http.StatusNotFound)
http.NotFound(res, req) // 用404,使接口存在性不能被嗅探到。
return
}
defer func() {
// 记录指标
setHttpMetrics(req, http.StatusOK)
}()
inner.ServeHTTP(res, req)
})
}
//===================包装普通请求,以获取请求和返回值状态==========
func httpBaseHandle(handler http.HandlerFunc) http.Handler {
return http.HandlerFunc(httpHandler(handler))
}
func httpHandler(handler http.HandlerFunc) http.HandlerFunc {
return func(res http.ResponseWriter, req *http.Request) {
fmt.Println("url:", req.RequestURI)
handler(res, req)
}
}
func wrapHandlerWithLogging(wrappedHandler http.Handler) http.Handler {
return http.HandlerFunc(func(w http.ResponseWriter, req *http.Request) {
fmt.Println(fmt.Sprintf("--> %s %s", req.Method, req.URL.Path))
lrw := NewLoggingResponseWriter(w)
wrappedHandler.ServeHTTP(lrw, req)
statusCode := lrw.statusCode
// 记录指标 (非 metrics 路由)
setHttpMetrics(req, statusCode)
fmt.Println(fmt.Sprintf("<-- %d %s", statusCode, http.StatusText(statusCode)))
})
}
//===============模拟接口请求===============
func listHandle(res http.ResponseWriter, req *http.Request) {
res.Write([]byte("list data here!! \n"))
}
func getNameHandle(res http.ResponseWriter, req *http.Request) {
res.Write([]byte("my name is zachke!! \n"))
}
func homeHandle(res http.ResponseWriter, req *http.Request) {
http.NotFound(res, req) // 如果到这边,说明就是没有 match 路由,直接返回 404
}
// 记录指标
func setHttpMetrics(req *http.Request, statusCode int) {
PromMetrics.HttpRequestsTotal.With(prometheus.Labels{
"code": strconv.Itoa(statusCode),
"method": req.Method,
"handle": req.RequestURI,
}).Inc()
}
从代码中可以看到,为了防止 metrics 接口被嗅探出来,我们做了两个防护措施:
- 重新命名
metrics, 将其改为myMetrics - 请求的时候,加上 http basic auth 校验
接下来我们自己先本地测试一下这个接口是否正常,run 起来之后,执行以下 curl:1
2
3
4
5
6
7
8
9
10
11
12
13
14
15
16
17
18
19
20
21
22
23
24
25
26
27
28
29
30
31
32
33
34
35
36
37
38> curl http://localhost:2112/getName
my name is zachke!!
> curl http://localhost:2112/getName111
404 page not found
> curl -X POST http://localhost:2112/list
list data here!!
> curl -X POST http://localhost:2112/list666
404 page not found
> curl http://localhost:2112/metrics
404 page not found
> curl http://prometheus:abc123451@localhost:2112/myMetrics
404 page not found
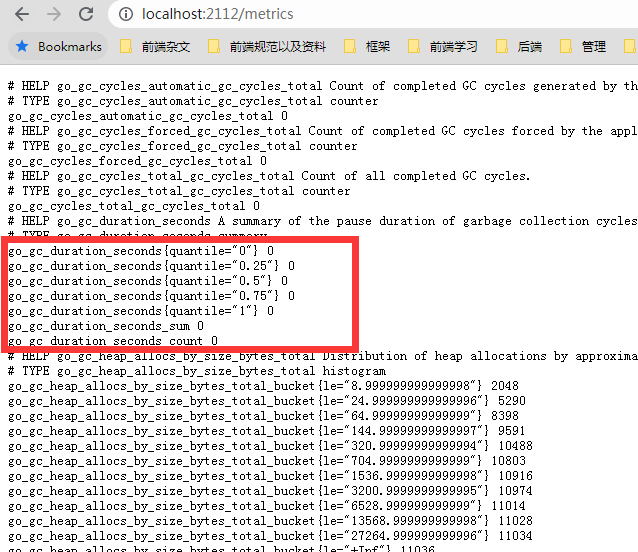
> curl http://prometheus:abc123456@localhost:2112/myMetrics
# HELP go_gc_cycles_automatic_gc_cycles_total Count of completed GC cycles generated by the Go runtime.
# TYPE go_gc_cycles_automatic_gc_cycles_total counter
go_gc_cycles_automatic_gc_cycles_total 0
...
# HELP myapp_cpu_usage The cpu usage
# TYPE myapp_cpu_usage gauge
myapp_cpu_usage 26.95312501084026
# HELP myapp_http_requests_total The total of HTTP requests.
# TYPE myapp_http_requests_total counter
myapp_http_requests_total{code="200",handle="/getName",method="GET"} 1
myapp_http_requests_total{code="200",handle="/list",method="POST"} 1
myapp_http_requests_total{code="404",handle="/getName111",method="GET"} 1
myapp_http_requests_total{code="404",handle="/list666",method="POST"} 1
myapp_http_requests_total{code="404",handle="/metrics",method="GET"} 1
myapp_http_requests_total{code="404",handle="/myMetrics",method="GET"} 1
# HELP myapp_memory_usage The memory usage
# TYPE myapp_memory_usage gauge
myapp_memory_usage 93
...
看起来没有问题, myapp_cpu_usage,myapp_http_requests_total,myapp_memory_usage 都有正常收集。 并且通过配置 http basic auth 来提供了访问安全
接下来我们配置到 prometheus 中, 在最下面配上增加这个 job 小节即可:1
2
3
4
5
6
7
8- job_name: 'my-app'
metrics_path: /myMetrics
basic_auth:
username: prometheus
password: abc123456
static_configs:
- targets:
- localhost:2112
然后然后热更新一下配置文件即可:1
2
3
4
5
6
7
8
9
10
11
12
13
14
15
16
17
18
19
20
21
22
23
24
25
26
27
28
29
30
31
32
33
34
35
36
37
38
39
40
41
42
43
44
45
46
47
48[root@VM-64-9-centos prometheus]# cat prometheus.yml
# my global config
global:
scrape_interval: 15s
evaluation_interval: 15s
alerting:
alertmanagers:
- static_configs:
- targets:
- "localhost:9093"
rule_files:
- "rules/*.yml"
scrape_configs:
- job_name: "prometheus"
static_configs:
- targets: ["localhost:9090"]
- job_name: "vmware-host"
static_configs:
- targets:
- 43.153.11.234:9100
- localhost:9100
- job_name: 'my-app'
  metrics_path: /myMetrics
  basic_auth:
    username: prometheus
    password: abc123456
  static_configs:
    - targets:
      - localhost:2112
# 检查配置
[root@VM-64-9-centos prometheus]# ./promtool check config prometheus.yml
Checking prometheus.yml
SUCCESS: 2 rule files found
SUCCESS: prometheus.yml is valid prometheus config file syntax
Checking rules/test-1.yml
SUCCESS: 3 rules found
Checking rules/test-record.yml
SUCCESS: 2 rules found
# 刷新配置文件
[root@VM-64-9-centos prometheus]# curl -X POST localhost:9090/-/reload
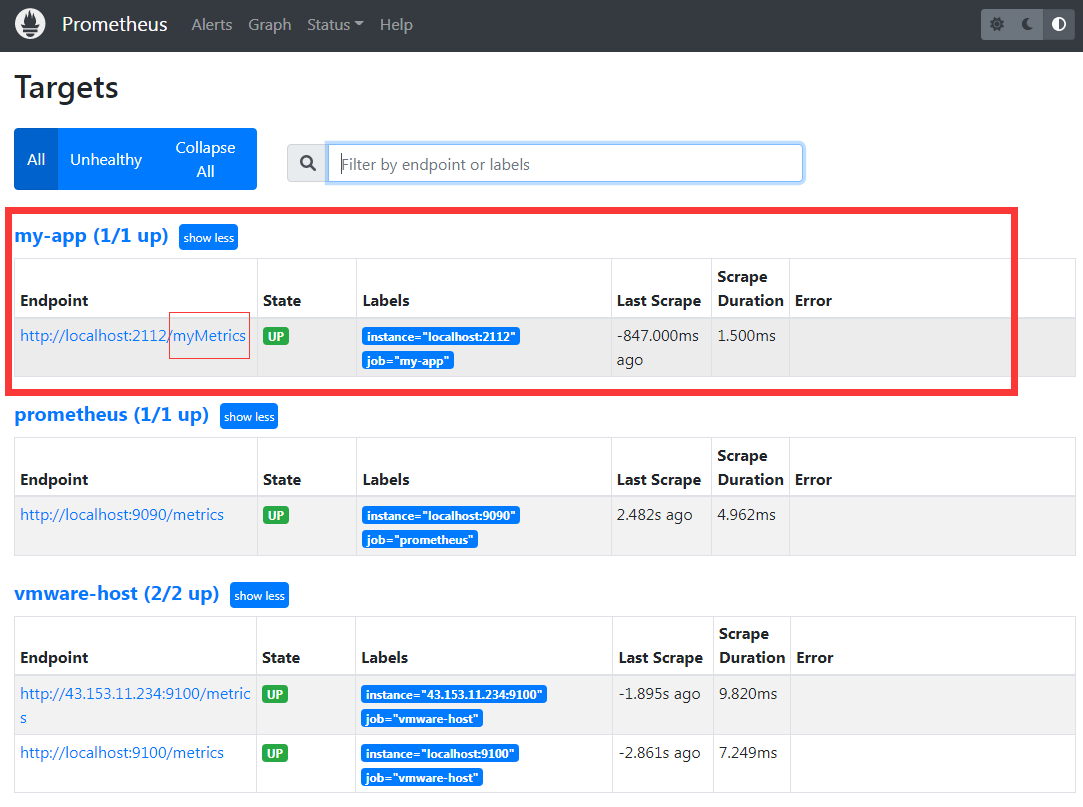
可以看到配置完之后,就可以看到监控的这一个实例了
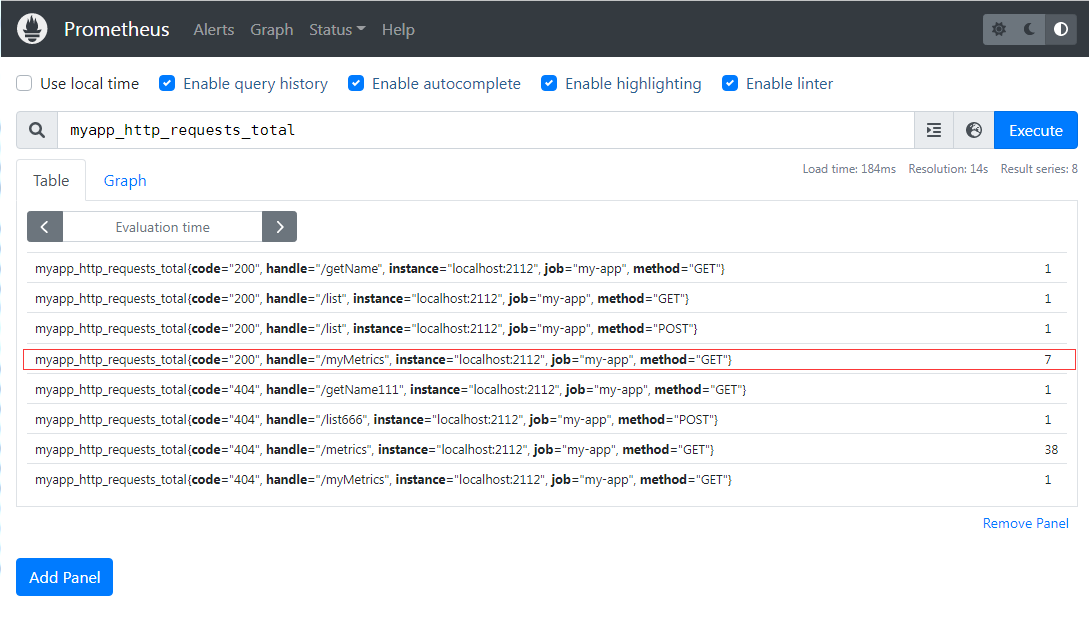
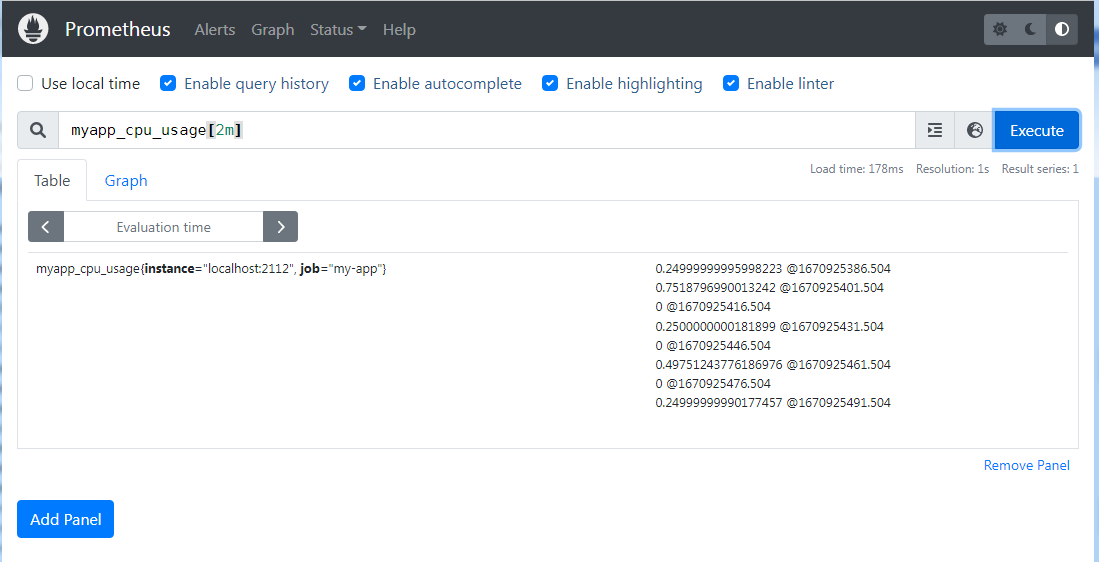
接下来我们尝试用 curl 请求几次,然后就可以在 prometheus 查看请求统计了
总结
通过本节,我们知道了怎么在我们的程序预埋 prometheus 的统计,并且通过自定义 metrics 路径和添加 http basic auth 加密方式来防止其他人可以嗅探我们的业务数据。
但是这个是针对长期在线的服务的,依赖的是让 prometheus server 来拉取。 那么有没有可能是我们主动推数据给 prometheus server, 如果是那种短时间执行的服务,比如批处理服务,也想抛送 prometheus,但是有可能等不到 prometheus server 过来拉数据的时候, 程序就执行完了。
针对这种情况,prometheus 提供了另一种主动 push 的方式,通过借助另一个中间件来完成, 这个就是 pushgateway。 下节讲这个
参考资料: