prometheus 介绍
1. 诞生背景
- IT 环境中,监控系统陈旧,监控指标单一,监控误报等,基于 zabbix 搭建,不能有效针对测试环境中k8s和容器的原生支持
- IT 环境监控类型繁多,有主机监控,也有应用监控。如:物理服务器、VMWare vSphere 虚拟化体系、交换机等网络设备、其他特殊主机、应用类监控,如 nginx 和 mysql 等
- IT 环境监控链路长,并指标复杂
2. 什么是 prometheus
Prometheus 是一个开源系统监控和警报工具包,最初由 SoundCloud 构建。自 2012 年启动以来,许多公司和组织都采用了 Prometheus,该项目拥有非常活跃的开发者和用户社区。它现在是一个独立的开源项目,独立于任何公司进行维护。为了强调这一点,并明确项目的治理结构,Prometheus 于 2016 年作为继 Kubernetes 之后的第二个托管项目加入了云原生计算基金会(CNCF)。
Prometheus 将其指标收集并存储为时间序列数据,即指标信息与记录时的时间戳以及称为标签的可选键值对一起存储。
3. 特点
prometheus 的主要特点是:
- 多维数据模型,可以按照实例,服务,端点和方法之类的维度随意对数据进行切片和切块
- 有自己的查询语言 PromQL,可以进行非常灵活和多样的查询
- 不依赖分布式存储;单个服务器节点是自治的, 可以随时随地部署监控服务
- 时间序列收集通过 HTTP 上的拉模型进行
- 通过中间网关(pushgateway)支持推送时间序列
- 通过服务发现或静态配置发现目标实例
- 多种图形和仪表板支持模式
4. 数据采集对象
prometheus 可以采集的对象实例非常广泛,小到一个程序的中间件,大到一个 kubernetes 的集群都可以
| 对象类型 | 采集器 | 导出器 |
|---|---|---|
| 网络协议 | HTTP、HTTPS、DNS、TCP、ICMP 和 gRPC等 | blackbox_exporter |
| 网络设备 | 路由器、交换机等 | snmp_exporter |
| 主机节点 | 虚拟主机、物理主机等 | node_exporter |
| 应用 | 延迟、错误、QPS、内部状态等 | Prometheus Client |
| 中间件 | 资源用量、服务状态等 | Prometheus Client |
| 容器 | 资源用量、状态等 | cAdvisor |
| 编排工具 | 集群资源用量、调度等 | Kubernetes Components |
5. 架构
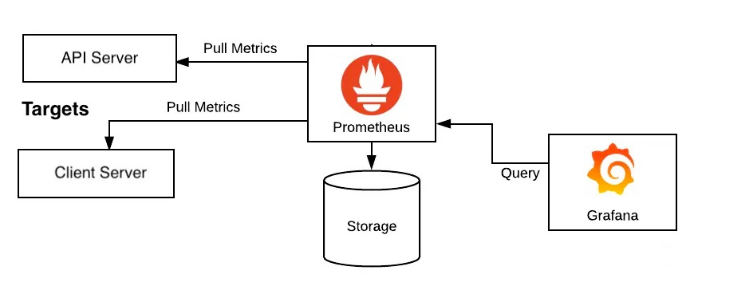
这边直接套用官网的架构图
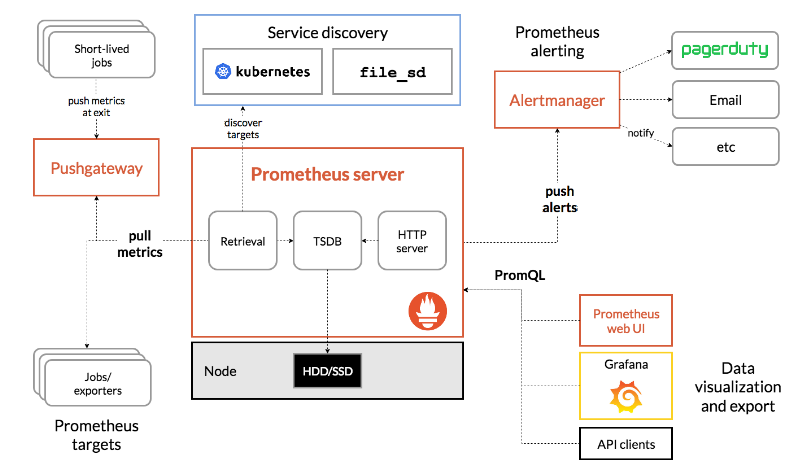
上面的架构其实很好理解,就分为几点,以 prometheus server 为服务端
prometheus server定期去执行对应的 作业(job) 到对应的有安装类似于 exporters 的实例 (instance) 去拉取数据- 有些生命周期比较短的服务,在执行完之后可以将数据先抛送给
pushgateway服务,然后pushgateway服务会等到prometheus server过来拉数据 prometheus server可以通过类似k8s或者文件服务发现类似的机制自动发现要拉取的实例prometheus server可以设置监控的 rule 规则,当触发规则的时候,可以将这一台预警抛送到alertmanager服务,然后alertmanager会去执行各种预警通知手段,比如 mail, 钉钉通知等等prometheus server存储的采集数据,可以通过grafana等 web ui 来渲染从而得到用户交互良好的监控界面
基于上面的监控体系,我们就可以自己来搭建内部的 IT 监控体系
实操安装
prometheus 有三种安装方式: installation
- 二进制安装
- github 源码安装
- docker 安装
其实三种都不难, 本次就采用 二进制 安装的方式来处理 (因为 prometheus 是 golang 语言写的,所以直接就是已经编译后的二进制文件了, 对环境几乎不存在依赖)
当然也可以直接用一整套的 docker-compose,包含 prometheus + grafana + pushgateway + alertmanager 一整套。这个在网上有不少,比如这个 docker-compose.yml, 因为本教程遵循循循渐进的方式,所以一开始并不会直接安装整个全家桶,而是需要的时候,再去临时安装对应的服务。
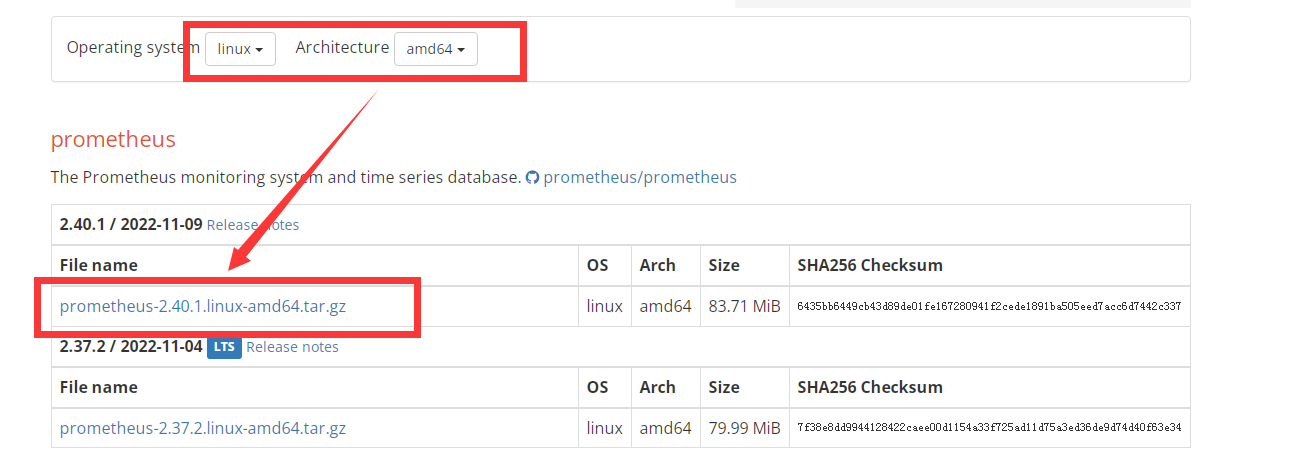
所以直接去官网查看要拉取的二进制的版本: 下载地址
因为我的系统是 CentOS7, 所以选择的是这个版本的二进制文件, 2.40.1 版本
具体安装指令如下:1
2
3
4
5
6
7
8
9
10
11
12
13
14
15
16
17
18
19
20
21
22
23
24
25
26
27
28
29
30
31
32
33# 下载解压
[root@VM-64-9-centos ~]# cd /usr/local/
[root@VM-64-9-centos local]# wget https://github.com/prometheus/prometheus/releases/download/v2.40.1/prometheus-2.40.1.linux-amd64.tar.gz
[root@VM-64-9-centos local]# tar -zxf prometheus-2.40.1.linux-amd64.tar.gz
[root@VM-64-9-centos local]# mv prometheus-2.40.1.linux-amd64/ prometheus
# 指定 owner (这边也可以单独创建一个 prometheus 的用户来作为这个目录的拥有者)
[root@VM-64-9-centos local]# chown root.root prometheus -R
# 创建 system 启动脚本
[root@VM-64-9-centos system]# cat /usr/lib/systemd/system/prometheus.service
[Unit]
Description=Prometheus
Documentation=https//prometheus.io/
After=network.target
[Service]
Type=simple
ExecStart=/usr/local/prometheus/prometheus --config.file=/usr/local/prometheus/prometheus.yml
ExecStop=/bin/kill -s QUIT $MAINPID
Restart=on-failure
[Install]
WantedBy=multi-user.target
# 设置开启自启动,并启动服务
[root@VM-64-9-centos local]# systemctl daemon-reload
[root@VM-64-9-centos local]# systemctl enable prometheus
[root@VM-64-9-centos local]# systemctl start prometheus
# 检查端口是否启动,如果启动的话,会有 9090 端口
[root@VM-64-9-centos system]# netstat -anlp | grep 9090
tcp6 0 0 :::9090 :::* LISTEN 7669/prometheus
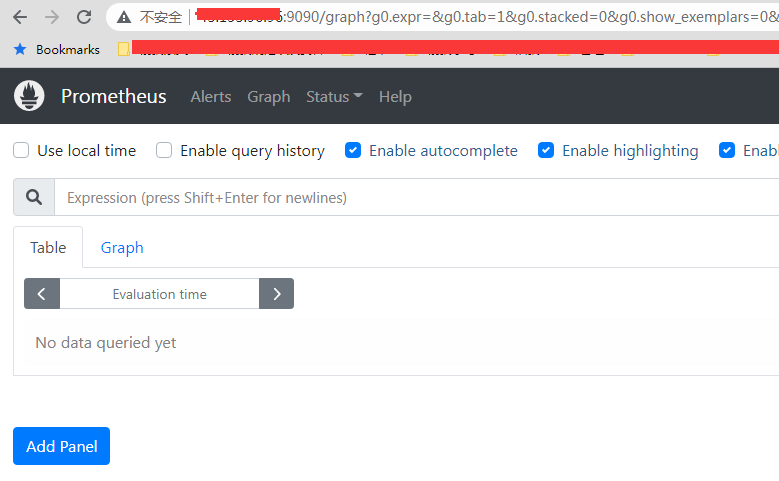
上面都完成了之后,就可以进入到 web 控制台了: http://ip:9090
配置文件分析
我们可以在后台看到当前的 target 监控对象
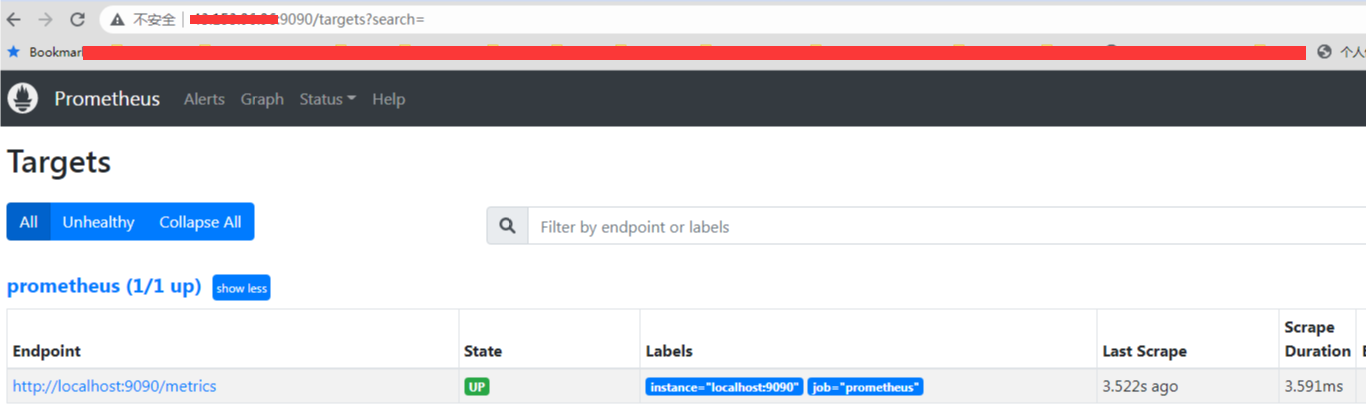
可以看到目前的监控对象,只有他自己。那么这个是在哪里配置的呢, 就是在 prometheus.yml 这个配置文件中配置, 而这个配置文件排除掉注释行, 有效内容如下:1
2
3
4
5
6
7
8
9
10
11
12
13
14[root@VM-64-9-centos ~]# cat /usr/local/prometheus/prometheus.yml
global:
scrape_interval: 15s
evaluation_interval: 15s
alerting:
alertmanagers:
- static_configs:
- targets:
scrape_configs:
- job_name: "prometheus"
static_configs:
- targets: ["localhost:9090"]
可以看到有分为 3 块节点配置,分别是:
- global 块全局配置
- alerting 块警报配置,但是因为没有配置目标实例 targets, 所以这一块其实也是无效的
- scrape_configs 块抓取配置, 这个也是最核心的,配置要抓取的作业以及对应的实例地址,目前这个配置的
localhost:9090其实就是 prometheus 这个服务自身, 所以就是自己监控自己
其实上面还有一些是默认的配置,没有放出来,上面那一份的配置文件,最全的应该是:1
2
3
4
5
6
7
8
9
10
11
12
13
14
15
16
17
18
19
20
21
22
23
24
25global:
scrape_interval: 15s
scrape_timeout: 10s
evaluation_interval: 15s
alerting:
alertmanagers:
- follow_redirects: true
enable_http2: true
scheme: http
timeout: 10s
api_version: v2
static_configs:
- targets: []
scrape_configs:
- job_name: prometheus
honor_timestamps: true
scrape_interval: 15s
scrape_timeout: 10s
metrics_path: /metrics
scheme: http
follow_redirects: true
enable_http2: true
static_configs:
- targets:
- localhost:9090
这个可以在 web 控制台的 config 路由看到完整的配置文件:
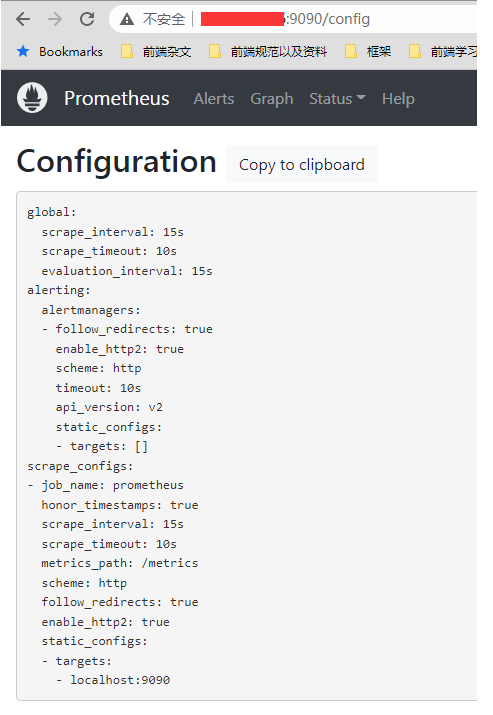
而 prometheus 的所有的监控策略都是在这个配置文件上配置的, 可以说非常的简单和粗暴
接下来我们就看看上面的配置都是啥意思, 首先找到官方的说明文档: configuration
因为我们安装的 2.40.1 是当前的最新版本,所以直接看最新版本的文档即可
如果要真的了解配置具体信息的话,因为他的配置其实非常的丰富和多样, 每一个小节点都有自己的配置项,直接去官方文档看最快,这边只是简单针对一些小节点做一下描述,以及最常用的节点监控的参数 (scrape_configs) 和 全局参数 (global) 进行说明
首先所有的小节点如下:1
2
3
4
5
6
7
8
9
10
11
12
13
14
15
16
17
18
19
20
21
22
23
24
25
26
27
28
29
30
31
32
33
34
35
36
37
38
39
40
41
42
43
44
45
46
47
48
49
50global:
# 默认抓取目标的频率, 默认一分钟,可以后面具体监控的时候再单独指定来覆盖这个全局配置
[ scrape_interval: <duration> | default = 1m ]
# 抓取请求超时,默认 10s 没有响应就算超时,可以后面具体监控的时候再单独指定来覆盖这个全局配置
[ scrape_timeout: <duration> | default = 10s ]
# 评估规则的频率,也是默认一分钟
[ evaluation_interval: <duration> | default = 1m ]
# 外部系统的扩展标签,包含远程存储或者警报
# 外部系统(联合、远程存储、Alertmanager)
external_labels:
[ <labelname>: <labelvalue> ... ]
# PromQL 查询记录到的文件
# 重新加载配置将重新打开文件
[ query_log_file: <string> ]
# 规则文件(一个 glob 列表). 相应规则和报警都会从里面读取
rule_files:
[ - <filepath_glob> ... ]
# 抓取配置列表
scrape_configs:
[ - <scrape_config> ... ]
# Alerting 指定与 Alertmanager 相关的设置
alerting:
alert_relabel_configs:
[ - <relabel_config> ... ]
alertmanagers:
[ - <alertmanager_config> ... ]
# 与远程写入功能相关的设置
remote_write:
[ - <remote_write> ... ]
# 与远程读取功能相关的设置
remote_read:
[ - <remote_read> ... ]
# 运行时可重新加载的存储相关设置
storage:
[ tsdb: <tsdb> ]
[ exemplars: <exemplars> ]
# 配置导出跟踪
tracing:
[ <tracing_config> ]
接下来就是具体抓取的配置了,也就是 scrape_configs 的这个配置节,因为配置项比较多, 所以单独拉出来。
scrape_config 部分指定了一组目标和描述如何抓取它们的参数。 在一般情况下,一个抓取配置指定一个作业。 在高级配置中,这可能会改变。 可以通过 static_configs 参数静态配置目标,也可以使用支持的服务发现机制之一动态发现目标。
此外,relabel_configs 允许在抓取之前对任何目标及其标签进行高级修改。
relabel 是功能强大的工具,可以在 target 被抓取之前动态重写目标的标签集, 每个 scrape 可以配置多个 relabel ,对不同的标签进行不同的操作, 后面会单独开一个篇章来讲一下这个 relabel 的机制
而 scrape_configs 这个配置节,其实就是一组的 job 的配置,所以我们只需要看 job 的配置参数即可:1
2
3
4
5
6
7
8
9
10
11
12
13
14
15
16
17
18
19
20
21
22
23
24
25
26
27
28
29
30
31
32
33
34
35
36
37
38
39
40
41
42
43
44
45
46
47
48
49
50
51
52
53
54
55
56
57
58
59
60
61
62
63
64
65
66
67
68
69
70
71
72
73
74
75
76
77
78
79
80
81
82
83
84
85
86
87
88
89
90
91
92
93
94
95
96
97
98
99
100
101
102
103
104
105
106
107
108
109
110
111
112
113
114
115
116
117
118
119
120
121
122
123
124
125
126
127
128
129
130
131
132
133
134
135
136
137
138
139
140
141
142
143
144
145
146
147
148
149
150
151
152
153
154
155
156
157
158
159
160
161
162
163
164
165
166
167
168
169
170
171
172
173
174
175
176
177
178
179
180
181
182
183
184
185
186
187
188
189
190
191# 作业名称
job_name: <job_name>
# 抓取频率,如果没有单独设置就走全局配置
[ scrape_interval: <duration> | default = <global_config.scrape_interval> ]
# 超时设置,如果没有单独设置就走全局配置
[ scrape_timeout: <duration> | default = <global_config.scrape_timeout> ]
# 从目标获取指标的 HTTP 资源路径,没有设置就默认为 /metrics
[ metrics_path: <path> | default = /metrics ]
# 控制 Prometheus 如何处理标签之间的冲突
[ honor_labels: <boolean> | default = false ]
# 也是解决标签冲突的配置,当 honor_labels 为 true 的时候,这个配置才有效
[ honor_timestamps: <boolean> | default = true ]
# 拉取的协议,默认 http
[ scheme: <scheme> | default = http ]
# 可选的 HTTP URL 参数
params:
[ <string>: [<string>, ...] ]
# basic auth 的配置
basic_auth:
[ username: <string> ]
[ password: <secret> ]
[ password_file: <string> ]
# 请求上设置 `Authorization` 标头
authorization:
[ type: <string> | default: Bearer ]
[ credentials: <secret> ]
[ credentials_file: <filename> ]
# 可选的 OAuth 2.0 配置
# 不能与basic_auth或授权同时使用
oauth2:
[ <oauth2> ]
# 配置抓取请求是否遵循 HTTP 3xx 重定向
[ follow_redirects: <boolean> | default = true ]
# 是否开启HTTP2
[ enable_http2: <bool> | default: true ]
# 配置抓取请求的 TLS 设置,https 的时候会用到
tls_config:
[ <tls_config> ]
# 可选代理 URL
[ proxy_url: <string> ]
# Azure 服务发现配置列表
azure_sd_configs:
[ - <azure_sd_config> ... ]
# Consul 服务发现配置列表
consul_sd_configs:
[ - <consul_sd_config> ... ]
# DigitalOcean 服务发现配置列表
digitalocean_sd_configs:
[ - <digitalocean_sd_config> ... ]
# Docker 服务发现配置列表
docker_sd_configs:
[ - <docker_sd_config> ... ]
# Docker Swarm 服务发现配置列表
dockerswarm_sd_configs:
[ - <dockerswarm_sd_config> ... ]
# DNS 服务发现配置列表
dns_sd_configs:
[ - <dns_sd_config> ... ]
# EC2 服务发现配置列表
ec2_sd_configs:
[ - <ec2_sd_config> ... ]
# Eureka 服务发现配置列表
eureka_sd_configs:
[ - <eureka_sd_config> ... ]
# 文件服务发现配置列表
file_sd_configs:
[ - <file_sd_config> ... ]
# GCE 服务发现配置列表
gce_sd_configs:
[ - <gce_sd_config> ... ]
# Hetzner 服务发现配置列表
hetzner_sd_configs:
[ - <hetzner_sd_config> ... ]
# HTTP 服务发现配置列表
http_sd_configs:
[ - <http_sd_config> ... ]
# IONOS 服务发现配置列表
ionos_sd_configs:
[ - <ionos_sd_config> ... ]
# Kubernetes 服务发现配置列表
kubernetes_sd_configs:
[ - <kubernetes_sd_config> ... ]
# Kuma 服务发现配置列表
kuma_sd_configs:
[ - <kuma_sd_config> ... ]
# Lightsail 服务发现配置列表
lightsail_sd_configs:
[ - <lightsail_sd_config> ... ]
# Linode 服务发现配置列表
linode_sd_configs:
[ - <linode_sd_config> ... ]
# Marathon 服务发现配置列表
marathon_sd_configs:
[ - <marathon_sd_config> ... ]
# AirBnB 的 Nerve 服务发现配置列表
nerve_sd_configs:
[ - <nerve_sd_config> ... ]
# Nomad 服务发现配置列表
nomad_sd_configs:
[ - <nomad_sd_config> ... ]
# OpenStack 服务发现配置列表
openstack_sd_configs:
[ - <openstack_sd_config> ... ]
# OVHcloud 服务发现配置列表
ovhcloud_sd_configs:
[ - <ovhcloud_sd_config> ... ]
# PuppetDB 服务发现配置列表
puppetdb_sd_configs:
[ - <puppetdb_sd_config> ... ]
# Scaleway 服务发现配置列表
scaleway_sd_configs:
[ - <scaleway_sd_config> ... ]
# Zookeeper Serverset 服务发现配置列表
serverset_sd_configs:
[ - <serverset_sd_config> ... ]
# Triton 服务发现配置列表
triton_sd_configs:
[ - <triton_sd_config> ... ]
# Uyuni 服务发现配置列表
uyuni_sd_configs:
[ - <uyuni_sd_config> ... ]
# 此作业的标记静态配置目标列表
static_configs:
[ - <static_config> ... ]
# 目标重新标记配置列表
relabel_configs:
[ - <relabel_config> ... ]
# 指标重新标记配置列表
metric_relabel_configs:
[ - <relabel_config> ... ]
# 抓取 body 体的最大值, 0 代表不限制
[ body_size_limit: <size> | default = 0 ]
# 抓取的样本比例,0 表示没有限制
[ sample_limit: <int> | default = 0 ]
# 每一个样本所允许的最大标签限制,0 表示没有限制
[ label_limit: <int> | default = 0 ]
# 标签的 name 最大长度限制,0 表示没有限制
[ label_name_length_limit: <int> | default = 0 ]
# 标签的 value 最大长度限制,0 表示没有限制
[ label_value_length_limit: <int> | default = 0 ]
# 改作用所抓取的主机的最大限制,0 表示没有限制
[ target_limit: <int> | default = 0 ]
看似很长,其实有一大部分都是各种第三方服务发现的兼容配置。 绝大部分下都用不到
job 还有一个次级节点,也就是 static_config 也是经常用到,这个就是要抓取的目标实例, 这个就比较简单,其实就两个配置项,一个是 目标实例 (instances),一个是 label1
2
3
4
5
6
7# The targets specified by the static config.
targets:
[ - '<host>' ]
# Labels assigned to all metrics scraped from the targets.
labels:
[ <labelname>: <labelvalue> ... ]
官方也有提供了一个配置文件的 demo 来参考: prometheus 的配置 demo 参考
所以回到刚安装的那个配置文件,我们就可以知道是什么意思:
- 首先全局配置了抓取的间隔是 15s,然后默认 10s 没有响应就超时 (这边虽然有配置 evaluation_interval(规则评估间隔) 为 15s,但是因为我们并没有设置 rules,所以这个配置不会用到)。
- 同时有设置一个抓取服务对象, 也就是 prometheus 自身, 然后服务所在地址是
localhost:9090, 然后协议是http, 抓取的 url 路由是/metrics
因此在没有设置 basic_auth 或者其他需要验证的情况下,我们就可以自己请求这个地址,来得到数据
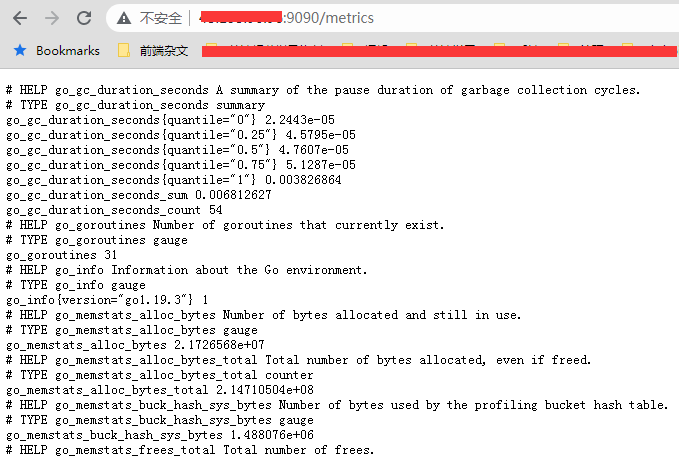
因为 prometheus 这个程序是用 golang 写的,所以可以看到抓取的指标就有很多 golang 的运行指标,比如当前的 go 版本是 1.19.3, 当前相关的 gc 参数之类的。
安装 node_exporter 来监控主机
我们知道 prometheus 要抓取的服务,这个服务要暴露一个用于抓取的 url,并且要提供符合相关规则的数据,才能匹配抓取。 这时候有些服务,他会兼容 prometheus 的抓取,会暴露对应的端口和路由以供抓取 (比如 prometheus 自身以及接下来要安装的 grafana 都有暴露)。 但是有些服务没有,对于这些服务,就要借助 exporter 这种客户端包来进行采集,然后等待 prometheus 过来 拉数据 (pull)
prometheus 有提供了很多的导出器(exporters)用于供 prometheus server 来拉取数据, 具体可以看: 导出器和集成
我们就取一个最常用的监控整个主机的包,也就是 node_exporter, 这个包就是用来收集当前主机的各个信息,然后让 prometheus server 过来拉取这些数据
node_exporter 的作用: 收集操作系统的基本系统,例如cpu,内存,硬盘空间等基本信息,并对外提供api接口用于prometheus查询存储。
启动会通过 9100 端口来进行监控数据的暴露,这个端口也可以在启动的时候通过参数指定来修改。
接下来我们安装一下, 一样取一个最新的下载包(一样走二进制包安装的方式),下载地址是: node_exporter
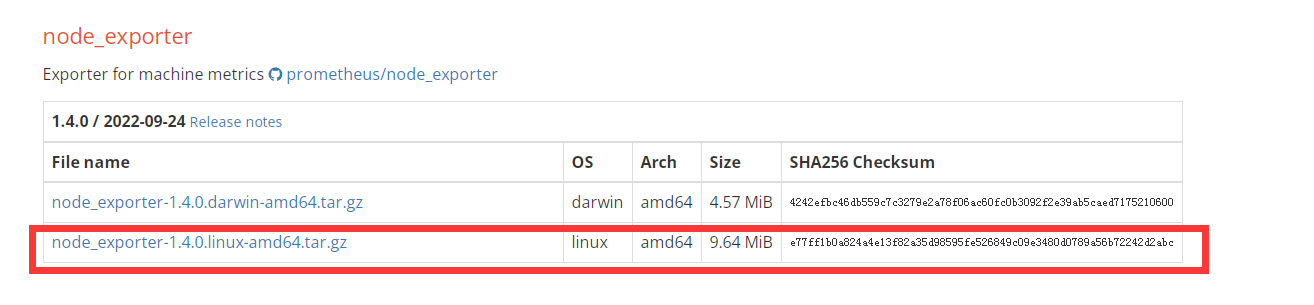
具体安装指令:1
2
3
4
5
6
7
8
9
10
11
12
13
14
15
16
17
18
19
20
21
22
23
24
25
26
27
28
29
30
31
32
33
34# 下载,加压
[root@VM-64-9-centos ~]# cd /usr/local/
[root@VM-64-9-centos local]# wget https://github.com/prometheus/node_exporter/releases/download/v1.4.0/node_exporter-1.4.0.linux-amd64.tar.gz
[root@VM-64-9-centos local]# tar xf node_exporter-1.4.0.linux-amd64.tar.gz
[root@VM-64-9-centos local]# mv node_exporter-1.4.0.linux-amd64 node_exporter
# 添加到 system 服务
[root@VM-64-9-centos local]# cat /usr/lib/systemd/system/node_exporter.service
[Unit]
Description=The node_exporter Server
Documentation=https://github.com/prometheus/node_exporter
After=network.target
[Service]
Type=simple
ExecStart=/usr/local/node_exporter/node_exporter
ExecStop=/bin/kill -s QUIT $MAINPID
Restart=on-failure
[Install]
WantedBy=multi-user.target
# 设置服务自启动并且启动服务
[root@VM-64-9-centos local]# systemctl daemon-reload
[root@VM-64-9-centos local]# systemctl enable node_exporter
[root@VM-64-9-centos local]# systemctl start node_exporter
[root@VM-64-9-centos local]# systemctl status node_exporter
● node_exporter.service - The node_exporter Server
Loaded: loaded (/usr/lib/systemd/system/node_exporter.service; enabled; vendor preset: disabled)
Active: active (running) since Wed 2022-11-23 17:57:53 CST; 6s ago
# 查看 9100 端口,这个也是暴露给 prometheus 的采集端口
[root@VM-64-9-centos local]# netstat -anlp | grep 9100
tcp6 0 0 :::9100 :::* LISTEN 2425/node_exporter
安装成功之后, 接下来我们就要将这一个实例添加到 prometheus 的采集 job 中,在 prometheus.yml 最后面补上这个:1
2
3- job_name: "node1"
static_configs:
- targets: ["localhost:9100"]
最后变成这样子:1
2
3
4
5
6
7
8
9
10
11
12
13
14
15
16
17
18
19
20[root@VM-64-9-centos local]# cat prometheus/prometheus.yml
# my global config
global:
scrape_interval: 15s
evaluation_interval: 15s
alerting:
alertmanagers:
- static_configs:
- targets:
# - alertmanager:9093
scrape_configs:
- job_name: "prometheus"
static_configs:
- targets: ["localhost:9090"]
- job_name: "node1"
  static_configs:
    - targets: ["localhost:9100"]
这边要注意格式的缩进,可以使用 promtool 来检测配置文件是否配置正确
然后重启服务让配置生效, 有一种是可以热更新加载配置文件的,后面会说到1
systemctl restart prometheus.service
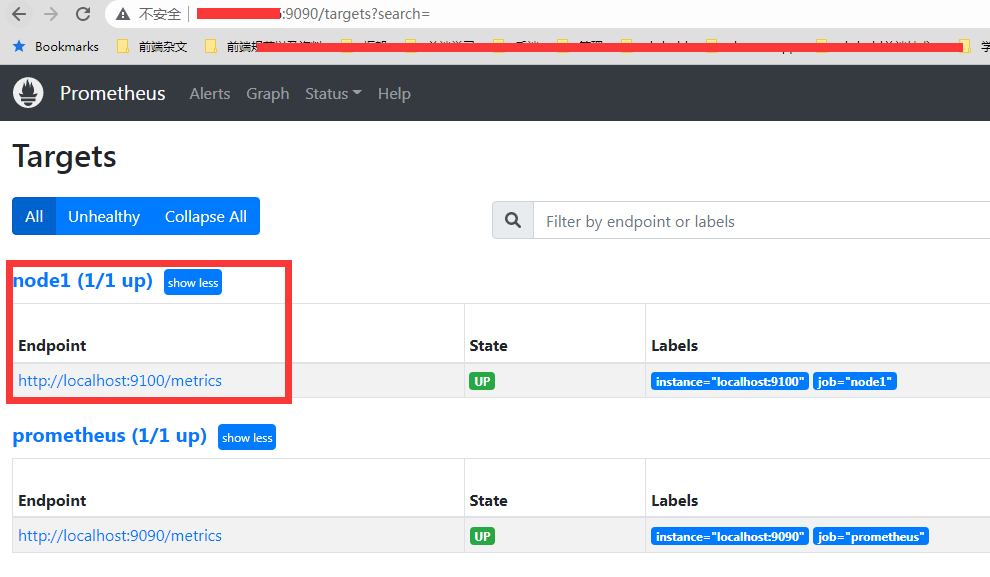
这时候就可以在 prometheus 后台的 target 看到多了这一个实例了
其他小细节
1. 使用 promtool 检测配置文件是否正确
因为 yml 格式的文件对缩进的格式有一定要求,所以建议在修改完配置文件之后, 用 promtool 工具来检测一下:1
2
3
4
5
6
7[root@VM-64-9-centos prometheus]# ./promtool check config prometheus.yml
Checking prometheus.yml
SUCCESS: 1 rule files found
SUCCESS: prometheus.yml is valid prometheus config file syntax
Checking test-rule.yml
SUCCESS: 2 rules found
他不仅可以检测 prometheus.yml 的格式是否正确,连同里面包含的 rule 的 yml 文件也会检测
因为我用的是 二进制包的方式来安装, 所以这个 promtool 是自带的,跟 prometheus 的二进制文件在同一个目录下,直接用就行了
2. 开启配置文件热更新
每次改完 yml 配置文件,都要重启服务。 但是 prometheus 有提供了一种方式可以通过 http api 的方式来热更新配置文件:1
curl -X POST localhost:9090/-/reload
不过这个配置默认是不开启的, 直接执行会报这个问题:1
2[root@VM-64-9-centos prometheus]# curl -X POST localhost:9090/-/reload
Lifecycle API is not enabled.
所以我们要开启 lifecycle api 才行, 这个是在启动的时候, 加上这个参数 --web.enable-lifecycle, 因此我们只需要在原先的 system 的启动文件中的 start 指令补上这个配置就行了:1
ExecStart=/usr/local/prometheus/prometheus --config.file=/usr/local/prometheus/prometheus.yml --web.enable-lifecycle
这样子就可以实现通过 curl http api 来达到动态加载配置文件的目的,不需要再去重启服务了。
总结
本节主要简单描述了一下 prometheus 是什么,为啥要用它, 以及安装了 prometheus server 服务,同时也部署这个 node_exporter 来监控当前这一台主机。
但是数据是都有抓了, 那么怎么看呢? 去哪里看呢? 以及 prometheus 是怎么抓数据的, 数据模型是什么, 这个我们会在下一节来讲到。
参考资料: